Recent Acquisitions (287)
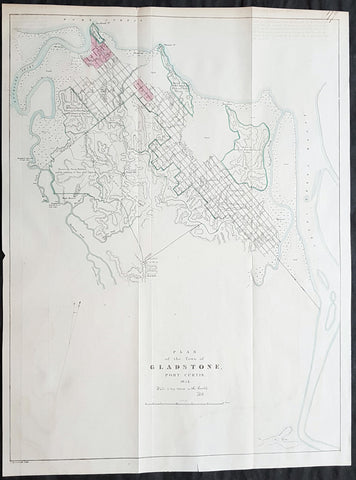
1854 John Arrowsmith Rare Antique Map, Early Town Plan of Gladstone, Queensland
Antique Map
- Title : Plan of the Town of Gladstone Port Curtis 1854 (Water is very scarce in this locality)
- Size: 22 1/4in x 16 3/4in (565mm x 425mm)
- Condition: (A+) Fine Condition
- Date : 1854
- Ref #: 82046
Description:
Description:
This large, rare & important map, a very early plan of the Queensland town of Gladstone by John Arrowsmith was engraved in 1854 - dated - and was published for The Colonial Office Parliamentary Papers, London.
The rarity of this map cannot be overstated. Many of these maps by Arrowsmith were printed and published only for the British Colonial Office Parliamentary Papers and would have numbered only in the 100s.
John Arrowsmith is considered one of the finest cartographers of the 19th century, famous for producing highly accurate and finely engraved maps in atlases, books & in sheet form, of all parts of the know world. Ironically he is less famous for producing many of the maps that accompanied the British Colonial Office Parliamentary Reports between 1817 to 1890, with two-thirds of the maps being produced by Arrowsmith. These maps were published solely for government review and not public sale. A few of these were subsequently published in Arrowsmiths Atlases and vice versa but a great number of them were not, making many of the maps published for the Parliamentary papers rare and rarely seen on the market. Many of them are not called for in Tooley, Clancy or other important reference material.
This is one of those maps, one of 27 we were fortunate to procure earlier this year. I have found very little historical sales data for these maps and so I have priced them based on what I feel is a fair market value for such a rare, scarce map.
Gladstone is a city in the Gladstone Region, Queensland, Australia. It is approximately 550 km (340 mi) by road north of Brisbane and 100 km south-east of Rockhampton. Situated between the Calliope and Boyne Rivers, Gladstone is home to Queensland\'s largest multi-commodity shipping port.
Before European settlement, the Gladstone region was home of the Toolooa (or Tulua), Meerooni and Baiali (or Byellee) Aboriginal tribes.
In May 1770, the HM Bark Endeavour, under the command of James Cook, sailed by the entrance to Gladstone Harbour under the cover of darkness. Matthew Flinders, during his 1801–1803 circumnavigation of Australia, became the first recorded European to sight the harbour in August 1802. He named the harbour Port Curtis, after Admiral Roger Curtis, a man who was of assistance to Flinders a year earlier at the Cape of Good Hope. John Oxley conducted further exploration of the harbour and surrounding countryside in November 1823. Oxley was dismissive of the region, noting the harbour was difficult to enter, the countryside was too dry, and the timber useless for construction purposes.
Nevertheless, in 1847 the British attempted to establish the new colony of North Australia at Port Curtis. Colonel George Barney was chosen to lead this experiment in colonisation and his expedition was eventful. On 25 January 1847, the Lord Auckland, carrying 87 soldiers and convicts, arrived off the southern entrance of Port Curtis and promptly ran aground on shoals off the southern tip of Facing Island. The settlers spent seven weeks on the island before being rescued by the supply ship Thomas Lowry and delivered the intended site of settlement, the region now known as Barney Point. On 30 January at a proclamation ceremony, Barney was sworn in as Lieutenant Governor of the colony of North Australia. The convict settlement lasted barely two months and cost the Imperial government ₤15,000. A change of government in Britain ordered the withdrawal of Barney and the settlers. However, interest in the region remained.
By 1853, Francis MacCabe was surveying the site of a new town on the shores of Port Curtis under the protection of several detachments of Native Police. Maurice O\'Connell was appointed government resident the following year, resulting in an influx of free settlers as land became available throughout the region. In 1863, the town became a Municipality with Richard Hetherington elected Gladstones first mayor. The fledgling town was named after the British Prime Minister William Ewart Gladstone and has a 19th-century marble statue on display in its town museum.
General Definitions:
Paper thickness and quality: - Heavy and stable
Paper color : - off white
Age of map color: - Original
Colors used: - Blue, pink, green
General color appearance: - Authentic
Paper size: - 22 1/4in x 16 3/4in (565mm x 425mm)
Plate size: - 22 1/4in x 16 3/4in (565mm x 425mm)
Margins: - Min 1/2in (12mm)
Imperfections:
Margins: - None
Plate area: - Folds as issued
Verso: - None
Background:
The importance of John Arrowsmiths contribution to early Australian cartography cannot be stressed enough. He was responsible for producing many of the early exploration maps of Australia for the Colonial Offices & Government publications as well as the RGS.
Maps produced after the first settlement and into the 19th century came from varied sources, first published with the First Fleet Journals by Arthur Phillip, John Hunter and Watkin Tench. Numerous European publishing houses produced atlases which included maps of Australia. Many came out in several editions and were updated as new information became available. The Australian Colonies were administered by officials responsible to the British Colonial Office and all events of importance, often illustrated by maps, were published in the British Parliamentary Papers. There a rea prime source of maps from 1830 onwards, although one or two maps may be found in Parliamentary Papers prior to this time, such as one example of a rare map of the Swan River by Captain James Stirling.
During the 19th century, as the Australian colonies were progressively granted responsible government, Parliamentary Papers for each colony became an important source of maps. These maps sources have been a hidden and untapped resource. Another good source of early maps is published journals of the explorers; the explorers earliest maps often accompanied reports in the
Journal of the Royal Geographical Society in the UK. Parallel development of Australian scientific institutions along with an interest in exploration was a strong feature of 19th century Australia. The Royal Geographical Society of Australasia was established with branches in NSW, Victoria, South Australia and Queensland. A number of important maps were published as separate sheets, increasingly by Australian printers and engravers such as Carmichael, Sands & Kenny, and Higginbotham, Robinson & Harrison.
Australian atlases were produced and repeat editions of cadastral surveys and maritime chats became increasingly available. Specialist maps were published from official sources, including geological and mineral maps. Towards the end of the century a plethora of thematic maps were published through a verity of media such as advertisements for land sales, tourists maps and street directories.
Parliamentary Papers British Parliamentary Papers were a funnel for all significant colonial events in the 19th century. They included over one hundred maps with information on topography, exploration and lad survey published between 1817 and 1890., with two-thirds of the maps being produced by John Arrowsmith. Few maps are found after the early 1860s. The maps accompanying papers relevant to gold discovery (1851-55) are a particularly good resource, documenting an important time in the history of Australia. Perhaps the most neglected source of early Australian maps are those included in the Colonial Parliamentary Papers published locally after 1836. The NSW Parliamentary Papers published between 1836 and 1900 contain over 2700 maps on 129 topics, providing a unique record of events considered important by the colonial administration. Land ownership and land use dominate, followed by maps of services relevant to land use, such as railways, roads, water supply and sewerage. Public health issues are recorded in maps as are maps of gold& mineral leases reflected the expanding diversity of the economy. The first map published in the NSW Parliamentary Papers, of the site of the new Government House, was lithographed by W.R. Baker in 1836. The total number of maps over the same period from other colonies was less than 2000 but again each colonies priorities were reflected by in the subjects covered. Tasmania reflected mainly geological and early convict disciplinary maps; South Australia, land administration and pastoral development; Victoria, maps relating to the development; Victoria, maps relating to the colonies infrastructure, especially railway and harbour development; Queensland, railway and mineral leases; Western Australia, a broad range that included two important technological innovations that shortened the time, and therefore the cost, of printing maps. Firstly , John Osborn in 1859, developed the use of a transfer paper method in photolithography which reduced printing time from days to hours. Secondly, Alfred Selwyn in 1860 used a steam-driven power press to print seven colour geological maps.
Royal Geographical Society published its first journal in 1832. This journal was to become the leading scientific medium available for explorers to publish the first news of their discoveries. However, not all explorers were published here. Between 1832 and 1880, 25 maps recorded of inland Australia, illustrating the journeys of 27 explorers. John Arrowsmith compiled 22 of the 25 maps published by the RGS again illustrating the importance of Arrowsmith to the expansion of early colonial cartography in Australia.
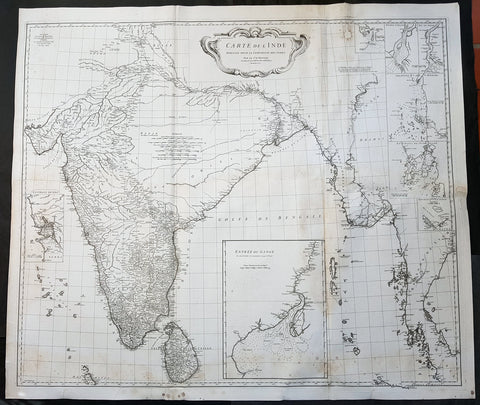
1752 D Anville Large Original Antique Map of India Sri Lanka Burma Siam - Scarce
Antique Map
- Title : Carte De L Inde Dressee Pour La Compagnie Des Indes...1752
- Size: 43in x 37 1/2in (1.1m x 950mm)
- Ref #: 92320
- Date : 1752
- Condition: (A) Very Good Condition
Description:
This large finely engraved scarce and highly detailed original antique map of India, Sri Lanka Burma & Thailand was engraved by Guillaume de la Haye in 1752 - dated in the tile cartouche - and was published in Jean-Baptiste Bourguinon D\'Anville\'s large elephant folio atlas Atlas Generale.
General Definitions:
Paper thickness and quality: - Heavy and stable
Paper color : - off white
Age of map color: -
Colors used: -
General color appearance: -
Paper size: - 43in x 37 1/2in (1.1m x 950mm)
Plate size: - 41in x 35in (1.04m x 890mm)
Margins: - Min 1in (25mm)
Imperfections:
Margins: - Spotting
Plate area: - Spotting, aging toning along folds as issued
Verso: - Spotting, aging toning along folds as issued
Background:
The map is drawn from numerous sources, including Ptolemy, Turkish and Indian geographies, and Jesuit surveys. More contemporary works by Bouchet in 1719 and Boudier in 1734 are seen both in the detail and inset river maps. The map reflects the level of knowledge of India & SE Asia at the time, especially of the interiors. The map has excellent detail of Southern India and coastlines were trade had been happening for centuries, but a conspicuous absence of detail of the northern interior
There are seven Inset maps that include the environs of Goa, entrance of the Ganges River and a wonderfully detailed depiction of the entrance to the Hugli River and other river tributes.
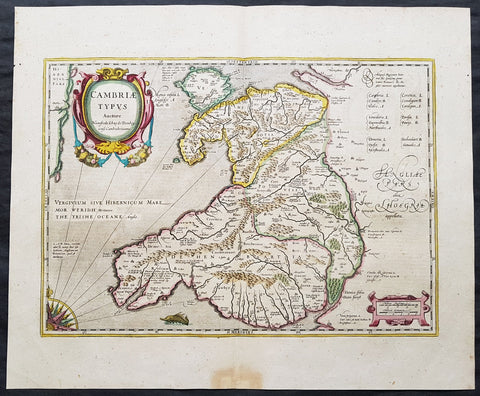
1639 Mercator & Hondius Large Old, Antique Map of Wales, GB - Humphrey Llwyd
- Title : Cambriae Typus Auctore Humfredo Lhuydo Denbigiense Cambrobritanno
- Date : 1639
- Size: 23in x 19in (590mm x 485mm)
- Ref #: 43139
- Condition: (A+) Fine Condition
Description:
This beautifully hand coloured original antique map of Wales - dedicated to its original creator the Welsh cartographer Lhuyd Humphrey - by Gerard Mercator was published by Jodocus Hondius in the 1639 French edition of Mercators Atlas.
One of the best examples I seen of this map to date, beautiful original hand colour with strong sturdy paper with a deep strong impression.
Humphrey Llwyd (also spelled Lhuyd) (1527–1568) was a Welsh cartographer , author, antiquary and Member of Parliament. He was a leading member of the Renaissance period in Wales along with other such men as Thomas Salisbury and William Morgan.
Llwyd was born in Denbigh, the county seat of the then county of Denbighshire at Foxhall, his family's estate. His father, Robert Llwyd, was descended from Harry Rossendale, henchman and grantee of the Earl of Lincoln. The first of the family that came to Wales from England appears to have been Foulk Rosindale, from whom Foxhall, or Foulk's Hall, was called. He married into the family of the Llwyd's of Aston, and probably from where his descendants derived their name, as well as their extraction from Einion Evell of the 12th Century. Einion Evell, Lord of part of Cynllaith, resided at Llwyn y Macn, in the parish of Oswestry. He and his twin brother, Cynwrig Evell, Lord of Y Glwyegl in Maelor Gymraeg, were the illegitimate sons of Madog ab Maredydd, Prince of Powys, by Eva, daughter of Madog (ab Einion Hael) ab Urien of Macn Gwynedd, ab Eginirab Lies ab Idnerth Benvras, Lord of Maesbrwg.
As a young man, he was educated at Brasenose College, Oxford and fared so well in the sciences and engineering that he was given a position as a physician to the Earl of Arundel during the Earl's tenure as Chancellor of the university. He was MP for East Grinstead during Elizabeth I's first parliament (1559).
In 1563, Llwyd returned to Denbigh and lived at Denbigh Castle at the permission of Sir John Salusbury who was then the Lord of the Manor of Denbigh. That year, he was elected MP for Denbigh Boroughs during Elizabeth's second Parliament where he promoted an act allowing the translation of the Bible into Welsh.
From 1566 he toured Europe, including Brussels, Augsburg, Milan, Padua and Venice. In Antwerp, he learnt from, and collaborated with, map maker Abraham Ortelius. In 1567, when Llwyd returned to Denbigh, he was given a stipend from the Crown to create the first printed map of Wales.
Llwyd died in 1568 and is buried in Whitchurch, a small chapel on the outskirts of Denbigh
Jodocus Hondius (1563 - 1612), one of the most notable engravers of his time, is known for his work in association with many of the cartographers and publishers prominent at the end of the sixteenth and the beginning of the seventeenth century.
In 1604 Hondius bought the plates of Mercator's Atlas which, in spite of its excellence, had not competed successfully with the continuing demand of the Ortelius Theatrum Orbis Terrarum.
To meet this competition Hondius added about 40 maps to Mercator's original number and from 1606 published enlarged editions in many languages, still under Mercator's name but with his own name as publisher. These atlases have become known as the Mercator/Hondius series. The following year the maps were re-engraved in miniature form and issued as a pocket Atlas Minor.
After the death of Jodocus Hondius the Elder in 1612, work on the two atlases, folio and miniature, was carried on by his widow and sons, Jodocus II and Henricus, and eventually in conjunction with Jan Jansson in Amsterdam. In all, from 1606 onwards, nearly 50 editions with increasing numbers of maps with texts in the main European languages were printed. (Ref: Koeman; M&B; Tooley)
Condition Report:
Paper thickness and quality: - Heavy & stable
Paper color: - off white
Age of map color: - Original
Colors used: - Yellow, pink, green, blue
General color appearance: - Authentic
Paper size: - 23in x 19in (590mm x 485mm)
Plate size: - 19 1/2in x 14in (500mm x 360mm)
Margins: - Min 1in (25mm)
Imperfections:
Margins: - Light toning to bottom of margin
Plate area: - None
Verso: - None
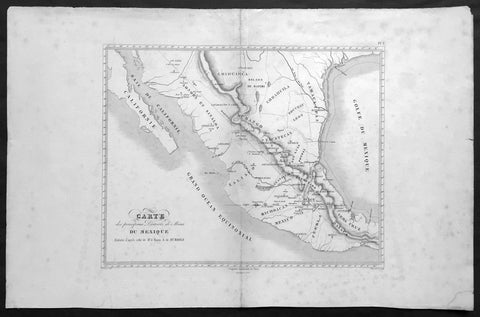
1843 Baron Von Humboldt Large Old, Antique Map of Texas & Mexico, Mining - Rare
Antique Map
- Title : Carte des principaux Districts de Mines Du Mexique Reduite d apres celle de Mr. le Baron A de Humbold
- Ref #: 61108
- Size: 22in x 14in (560mm x 360mm)
- Date : 1843
- Condition: (A+) Fine Condition
Description:
This large, scarce original, antique map* showing the location of Mines in Texas and Mexico in the early part of the 19th century by Baron Humboldt was engraved by Dutos in 1843. This map is scarce with no other example available currently on the market.
Friedrich Wilhelm Heinrich Alexander von Humboldt (14 September 1769 – 6 May 1859) was a Prussian geographer, naturalist, explorer, and influential proponent of Romantic philosophy and science. He was the younger brother of the Prussian minister, philosopher, and linguist Wilhelm von Humboldt (1767–1835). Humboldt's quantitative work on botanical geography laid the foundation for the field of biogeography. Humboldt's advocacy of long-term systematic geophysical measurement laid the foundation for modern geomagnetic and meteorological monitoring.
Between 1799 and 1804, Humboldt travelled extensively in Latin America, exploring and describing it for the first time from a modern scientific point of view. His description of the journey was written up and published in an enormous set of volumes over 21 years. Humboldt was one of the first people to propose that the lands bordering the Atlantic Ocean were once joined (South America and Africa in particular). Humboldt resurrected the use of the word cosmos from the ancient Greek and assigned it to his multi-volume treatise, Kosmos, in which he sought to unify diverse branches of scientific knowledge and culture. This important work also motivated a holistic perception of the universe as one interacting entity. (Ref: M&B; Tooley)
General Description:
Paper thickness and quality: - Light & stable
Paper color: - White
Age of map color: -
Colors used: -
General color appearance: -
Paper size: - 22in x 14in (560mm x 360mm)
Paper size: - 15in x 13in (390mm x 330mm)
Margins: - Min 2in (50mm)
Imperfections:
Margins: - Age toning, light spotting
Plate area: - Light uplift along centerfold
Verso: - Age toning, light spotting
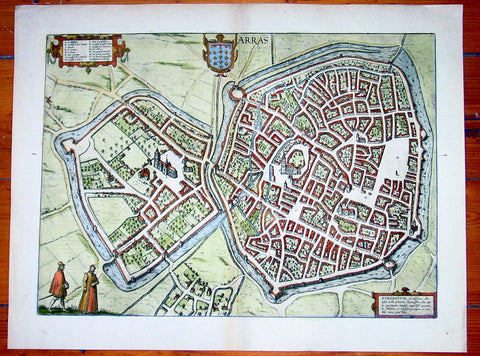
1575 Braun & Hogenberg Large Antique Map of the City of Arras, France
Antique Map
- Title : Arras
- Date : 1575
- Condition: (A+) Fine Condition
- Ref: 92833
- Size: 21in x 16in (535mm x 410mm)
Description:
This fine beautifully hand coloured original antique map a birds-eye view of the French City of Arras - the capital of the Pas de Calais region - was published by Georg Braun & Frans Hogenberg for the 1575 atlas of town plans Civiates Orbis Terrarum Vol II (1572-1612) intended as a companion to Abraham Ortelius's master Atlas Theatrum Orbis Terrarum published in 1570.
Background of Civitates Orbis Terrarum
The first volume of the Civitates Orbis Terrarum was published in Cologne in 1572. The sixth and the final volume appeared in 1617.
This great city atlas, edited by Georg Braun and largely engraved by Franz Hogenberg, eventually contained 546 prospects, bird-eye views and map views of cities from all over the world. Braun (1541-1622), a cleric of Cologne, was the principal editor of the work, and was greatly assisted in his project by the close, and continued interest of Abraham Ortelius, whose Theatrum Orbis Terrarum of 1570 was, as a systematic and comprehensive collection of maps of uniform style, the first true atlas.
For a variety of reasons town plans were comparatively latecomers in the long history of cartography. Few cities in Europe in the middle ages had more than 20,00 inhabitants and even London in the late Elizabethan period had only 100-150,000 people which in itself was probably 10 times that of any other English city. The Nuremberg Chronicle in 1493 included one of the first town views of Jerusalem, thereafter, for most of the sixteenth century, German cartographers led the way in producing town plans in a modern sense. In 1544 Sebastian Munster issued in Basle his Cosmographia containing roughly sixty-six plans and views, some in the plan form, but many in the old panorama or birds eye view. (Ref: Tooley; M&B)
Condition Report:
Paper thickness and quality: - Heavy and stable
Paper color: - off white
Age of map color: - Early
Colors used: - Green, blue, red, yellow
General color appearance: - Authentic
Paper size: - 21in x 16in (535mm x 410mm)
Plate size: - 19in x 14in (485mm x 355mm)
Margins: - Min 1in (25mm)
Imperfections:
Margins: - None
Plate area: - None
Verso: - None
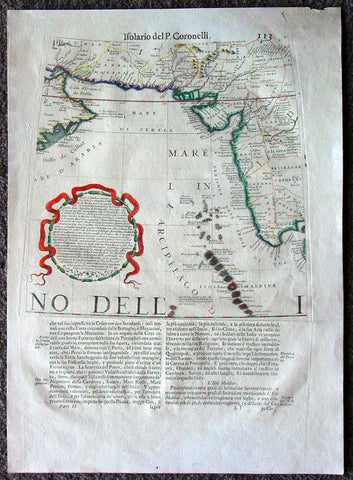
1696 Coronelli Antique Map, Globe Gore, of India, Pakistan, Iran, Persian Gulf
Antique Map
- Title : Isolario del P. Coronelli
- Date : 1696
- Condition: (A+) Fine Condition
- Ref: 42007
- Size: 19 1/2in x 14in (495mm x 355mm)
Description:
This is a rare opportunity to acquire an original antique Globe Gore of India and parts of the Middle East& Persia by Vincenzo Coronelli published in his 1696 edition ofIsolario dell' Atlante Veneto.
The copper-plates for these gores were originally engraved by Coronelli for the construction of the large 42in (110cm) terrestrial globe.
Coronelli published 2 different globe gore atlases, the 1693 edition of Libero dei Globiand the 1696 edition of Isolario dell' Atlante Veneto. The difference being the inclusion of Latin text to the latter publication.
Background:
In the early 1680’s Vincenzo Coronelli constructed two vast 15ft diameter terrestrial & celestial globes for Louis XIV of France. These were meticulously hand drawn & engraved. Such was the admiration of these Globes that in 1688 Coronelli began the engraving & publication of Globe Gores for the construction of two 110cm (42in) terrestrial & celestial globes.
Coronellis claim to have produced the best globes of any age was exemplified by the high demand and purchase of the globes by various institutions & cities within Europe. Yet many scholars still did not have the opportunity to visit Paris, London, Rome or Venice to view them and so Coronelli devised his famous atlas Libero dei Globi the first atlas of globe gores ever produced. The Libroformed part of a great series of atlases by Coronelli, the Atlante Veneto, in which Coronelli was able to combine the two cartographic art forms in which he excelled, maps & globes.
The engraving of the gores was of the highest standard with neat contrasting lettering and five large cartouches of a singular grace and elegance. One cartouche situated below Australia carries a portrait of the author and Pope Alexander VI.
Some of the more interesting features contained within the Gores are the recording of recent French explorations in North America, such as La Salles journey to the mouth of the Mississippi in 1681-87 & the French possessions within North America. Elsewhere the Caspian Sea is drawn closer to its modern shape, the Nile in Africa is shown without its fictitious source and the Blue Nile is shown correctly from a large lake in Ethiopia. The tracks of Le Maire crossing of the Pacific in 1616 are marked, as is the voyage of Chaumont to Siam in 1685-6. There are an unusual number of legends, all explanatory and informative along with many vignettes of ships and fishing scenes throughout the globe.
Coronelli was one of the finest engravers & cartographers of any era, producing some of the most stunning work ever seen. These Globe Gores are no exception. Coronelli was a master craftsman with an eye for detail. You can feel the uncompromising accuracy & passion in his work when you study his maps & globes.
These globe gores are scarce, with only a few sales records from the last 25 years. Similarly there is very little choice currently on the market. This scarcity ensures ongoing value and future appreciation. (Ref: Shirley 538; Tooley; Dr. Helen Wallis The Map Collector Dec 1980;Armao, Ermanno. Vincenzo Coronelli Cenni sull'uomo e la sua Vita Catalogo... Bibliopolis, Florence pp.130-134)
General Description:
Paper thickness and quality: - Heavy and stable
Paper color: - white
Age of map color: - Early
Colors used: - Green, yellow, pink, red
General color appearance: - Fresh
Paper size: - 19 1/2in x 14in (495mm x 355mm)
Plate size: - 11 1/2in x 11in (295mm x 280mm)
Margins: - min. 1/2in (12mm)
Imperfections:
Margins: - None
Plate area: - None
Verso: - None
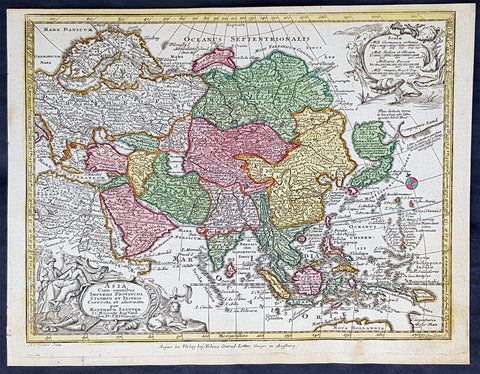
1744 Georg Mattaus Seutter Antique Map of Asia
Antique Map
- Title : Asia a Matth. Seutteri...T C Lotter, Geogr.
- Ref #: 93389
- Size: 11in x 8 1/2in (280mm x 215mm)
- Date : 1744
- Condition: (A+) Fine Condition
Description:
These beautifully hand coloured original copper-plate engraved antique map was engraved by Tobias Lotter and published in the 1744 edition of GM Seutters Atlas Minor Prae cipua Orbis Terrarum Imperia Regna et Provincias...., Augsburg, Germany.
General Definitions:
Paper thickness and quality: - Heavy and stable
Paper color : - off white
Age of map color: - Early
Colors used: - Yellow, green, blue, pink
General color appearance: - Authentic
Paper size: - 11in x 8 1/2in (280mm x 215mm)
Plate size: - 10 1/2in x 8in (265mm x 205mm)
Margins: - Min 1/4in (5mm)
Imperfections:
Margins: - None
Plate area: - None
Verso: - None
Background:
Atlas Minor was a series of beautiful maps of all parts of the world. Georg Matthäus Seutter was one of the most and important of the German cartographers of the 18th century, being appointed as the Geographer to the Imperial Court. His son, Albrecht Carl, joined Matthäus and eventually inherited the business. The maps from Atlas Minor were drawn by the two Seutters and engraved by Tobias Conrad Lotte. These maps are highly detailed and engraved with a bold hand with equally strong original hand color in the body of the map as was the 18th century German style. The cartouches were left uncolored in order to emphasize the elaborately detailed illustrations for which German maps are especially prized. These are some of the most decorative and interesting maps of the eighteenth century.
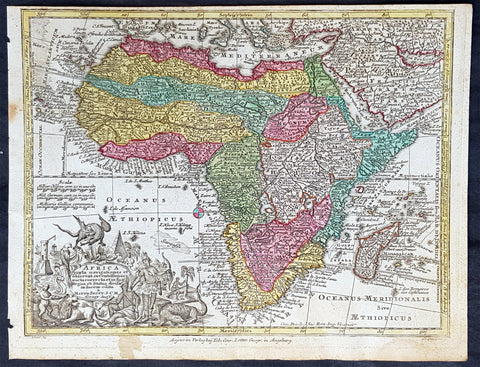
1744 Georg Mattaus Seutter Antique Map of Africa
Antique Map
- Title : Africa a Matth. Seutteri...T C Lotter, Geogr.
- Ref #: 93390
- Size: 11in x 8 1/2in (280mm x 215mm)
- Date : 1744
- Condition: (A+) Fine Condition
Description:
These beautifully hand coloured original copper-plate engraved antique map was engraved by Tobias Lotter and published in the 1744 edition of GM Seutters Atlas Minor Prae cipua Orbis Terrarum Imperia Regna et Provincias...., Augsburg, Germany.
General Definitions:
Paper thickness and quality: - Heavy and stable
Paper color : - off white
Age of map color: - Early
Colors used: - Yellow, green, blue, pink
General color appearance: - Authentic
Paper size: - 11in x 8 1/2in (280mm x 215mm)
Plate size: - 10 1/2in x 8in (265mm x 205mm)
Margins: - Min 1/4in (5mm)
Imperfections:
Margins: - Age toning to margins
Plate area: - None
Verso: - None
Background:
Atlas Minor was a series of beautiful maps of all parts of the world. Georg Matthäus Seutter was one of the most and important of the German cartographers of the 18th century, being appointed as the Geographer to the Imperial Court. His son, Albrecht Carl, joined Matthäus and eventually inherited the business. The maps from Atlas Minor were drawn by the two Seutters and engraved by Tobias Conrad Lotte. These maps are highly detailed and engraved with a bold hand with equally strong original hand color in the body of the map as was the 18th century German style. The cartouches were left uncolored in order to emphasize the elaborately detailed illustrations for which German maps are especially prized. These are some of the most decorative and interesting maps of the eighteenth century.
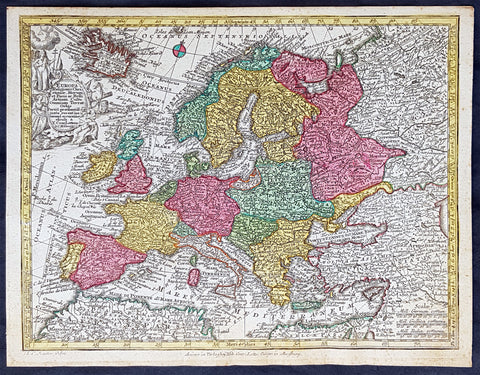
1744 Georg Mattaus Seutter Antique Map of Europe
Antique Map
- Title : Europa a Matth. Seutteri...T C Lotter, Geogr.
- Ref #: 93388
- Size: 11in x 8 1/2in (280mm x 215mm)
- Date : 1744
- Condition: (A+) Fine Condition
Description:
These beautifully hand coloured original copper-plate engraved antique map was engraved by Tobias Lotter and published in the 1744 edition of GM Seutters Atlas Minor Prae cipua Orbis Terrarum Imperia Regna et Provincias...., Augsburg, Germany.
General Definitions:
Paper thickness and quality: - Heavy and stable
Paper color : - off white
Age of map color: - Early
Colors used: - Yellow, green, blue, pink
General color appearance: - Authentic
Paper size: - 11in x 8 1/2in (280mm x 215mm)
Plate size: - 10 1/2in x 8in (265mm x 205mm)
Margins: - Min 1/4in (5mm)
Imperfections:
Margins: - None
Plate area: - None
Verso: - None
Background:
Atlas Minor was a series of beautiful maps of all parts of the world. Georg Matthäus Seutter was one of the most and important of the German cartographers of the 18th century, being appointed as the Geographer to the Imperial Court. His son, Albrecht Carl, joined Matthäus and eventually inherited the business. The maps from Atlas Minor were drawn by the two Seutters and engraved by Tobias Conrad Lotte. These maps are highly detailed and engraved with a bold hand with equally strong original hand color in the body of the map as was the 18th century German style. The cartouches were left uncolored in order to emphasize the elaborately detailed illustrations for which German maps are especially prized. These are some of the most decorative and interesting maps of the eighteenth century.
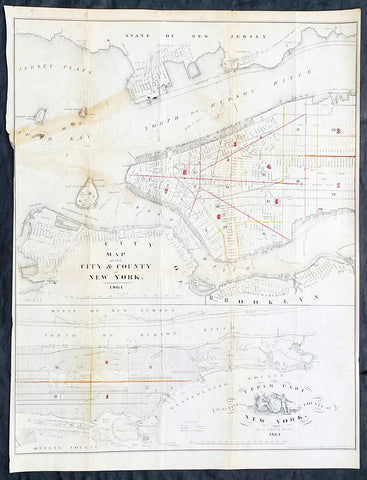
1861 D T Valentine Antique Map of New York City in two parts
Antique Map
- Title : Map of The City & County of New York 1861
- Date : 1861
- Size: 21 3/4in x 16 1/2in (525mm x 420mm)
- Condition: (B) Good Condition
- Ref: 93130
Description:
Description:
This original hand coloured lithograph antique, 2 part map was published by David T. Valentine in the 1861 edition of Manual of the Common Council of the City of New York
General Definitions:
Paper thickness and quality: - Light and stable
Paper color : - off white
Age of map color: - Original
Colors used: - Red, yellow
General color appearance: - Authentic
Paper size: - 21 3/4in x 16 1/2in (525mm x 420mm)
Plate size: - 21 3/4in x 16 1/2in (525mm x 420mm)
Margins: - Min 1/8in (5mm)
Imperfections:
Margins: - Left margin cropped close to border
Plate area: - Folds as issued, old tape mark & light creasing
Verso: - Folds as issued, old tape mark & light creasing
Background:
An scarce map of New York City by D. T. Valentine, divided into two sections. The primary map details Manhattan from 38th street to the Battery, including parts of Brooklyn, Governors Island, Ellis Island, Bedloe Island (Statue of Liberty), Jersey City, and Hoboken.
The lower map focuses on upper Manhattan north of 38th street and includes Roosevelt Island, Wards Island, Randals Island, and parts of Queens. Both maps show the street grid in some detail noting all major streets and some important buildings. A stylized seal of New York City appears in the lower left quadrant.
Valentine, David Thomas 1801 - 1869
As the Clerk of the Common Council of New York City, Valentine edited and published a series of books on the history and contemporary facts of New York City entitled Manual of the Corporation Of The City of New York. They became know as Valentines Manuals with updates published annually, between 1841 & 1870. Valentine used his manuals to produce some of the rarest and most important maps & views of the city of New York, some of which occasionally appear on the market. His contribution to the historical record of New York city cannot be over stated.
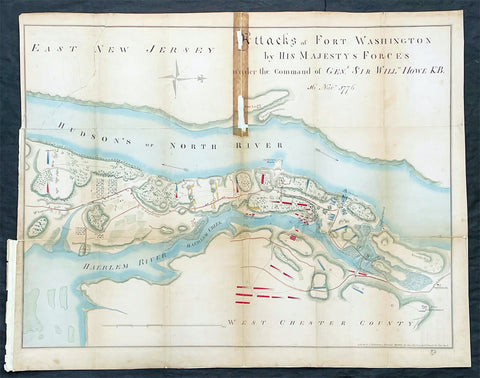
1861 (1776) Valentine Antique Revolutionary Map of Attack on New York City
Antique Map
- Title : Attacks of Fort Washington by His Majesty's Forces under The Command of General. Sir William Howe KB...Lith for D T Valentines Manual for 1861 by Geo. Hayward 171 Pearl St New York
- Date : 1861 (1776)
- Size: 25in x 18 1/2in (585mm x 470mm)
- Condition: (B) Good Condition
- Ref: 93166
Description:
Description:
This original hand coloured lithograph antique map, a reproduction of the famous Revolutionary map of 1776, was bound into David T. Valentine's 1861 edition of Manual of the Common Council of the City of New York
The map is oriented with north to the right. Hachures show relief, and military units are depicted in red and blue. The map was said to have been copied from an original map kindly loaned to the compiler by Mr. A. Suart.
General Definitions:
Paper thickness and quality: - Heavy and stable
Paper color : - off white
Age of map color: - Original
Colors used: - Yellow, green, blue, pink
General color appearance: - Authentic
Paper size: - 25in x 18 1/2in (585mm x 470mm)
Plate size: - 25in x 18 1/2in (585mm x 470mm)
Margins: - Min 1/2in (10mm)
Imperfections:
Margins: - Age toning, folds as issued
Plate area: - Folds as issued, old tape mark and some loss to the top middle fold
Verso: - Folds as issued
Background:
On 16 November 1776, the Hessian General Wilhelm von Knyphausen and his army of of 8,000 German mercenaries and British regulars attacked Fort Washington (now the location of Bennet Park at the intersection of Fort Washington Avenue and 183rd Street) making use of information provided by the first American traitor, William Demont, the fort's adjutant. Although the fort's defenders were initially able to provide stiff resistance, they were eventually outflanked, and the the 3,000 man garrison was captured. The Americans were then imprisoned within British prison ships anchored in New York Harbor where a great many died of starvation and disease. John and Margaret Corbin were both casualties of the battle. John was an artilleryman who was killed in the midst of the fight. When he fell, his wife Margaret (Molly), who had accompanied him as a camp follower, took his place at the cannon and continued to clean, load, and fire the gun until she was severely wounded in the left arm. Three years later, Captain Molly, who had lost the use of her arm, became the first woman to receive a military penison from the United States.
Valentine, David Thomas 1801 - 1869
As the Clerk of the Common Council of New York City, Valentine edited and published a series of books on the history and contemporary facts of New York City entitled Manual of the Corporation Of The City of New York. They became know as Valentines Manuals with updates published annually, between 1841 & 1870. Valentine used his manuals to produce some of the rarest and most important maps & views of the city of New York, some of which occasionally appear on the market. His contribution to the historical record of New York city cannot be over stated.
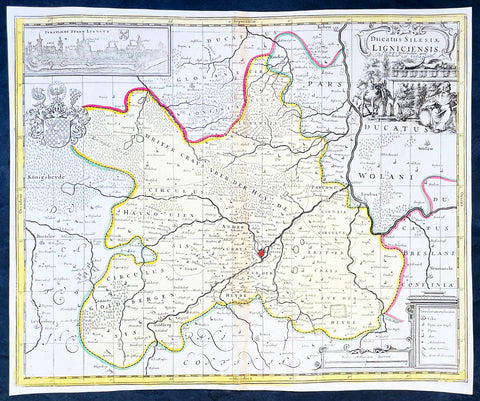
1700 Jan Jansson & Schenk Antique Map of Duchy of Legnica, Silesia South Poland
Antique Map
- Title : Ducatus Silesiae Ligniciensis Pet. Schenk et G Valk
- Ref #: 35636
-
Condition: (A+) Fine Condition
- Size: 19in x 14 3/4in (480mm x 375mm)
- Date : 1700
- Price: $225US
Description:
This original hand coloured large copper plate engraved antique map of the City and Regions of The Duchy of Legnica (Ligniciensis) in Lower Silesia, southern Poland, after Jan Jansson, was published by Peter Schenk Gerard Valck in 1700.
General Definitions:
Paper thickness and quality: - Heavy and stable
Paper color : - off white
Age of map color: - Original
Colors used: - Yellow, green, blue, pink
General color appearance: - Authentic
Paper size: - 19in x 14 3/4in (480mm x 375mm)
Plate size: - 18 1/2in x 14in (465mm x 355mm)
Margins: - Min 1/4in (5mm)
Imperfections:
Margins: - None
Plate area: - Age toning along centerfold
Verso: - None
Background:
The Duchy of Legnica or Duchy of Liegnitz was one of the Duchies of Silesia. Its capital was Legnica (Liegnitz) in Lower Silesia.
Legnica Castle had become a residence of the Silesian dukes in 1163 and from 1248 was the seat of a principality in its own right, ruled by the Silesian branch of the Piast dynasty until the extinction of the line in 1675. Formed by Bolesław II the Bald, Duke of Lower Silesia at Wrocław, Legnica shared the fate of most of the others Silesian duchies, falling into Bohemian, Austrian and eventually—after the First Silesian War—Prussian spheres of influence.
The town of Legnica became famous for the Battle of Legnica that took place at the nearby village of Legnickie Pole on 9 April 1241, during the Mongol invasion of Poland. A Christian army led by the Polish High Duke Henry II the Pious, supported by the feudal nobility including Poles, Bavarian miners and military orders, was decisively defeated by the Mongols. Although Henry was killed and his forces defeated, their advance into Europe was halted when they turned back to attend to the election of a new Khagan (Grand Khan) following the death of Ögedei Khan in the same year. Minor celebrations are held annually in Legnica to commemorate the battle.
After Henry's death his eldest son Bolesław II the Bald followed him as ruler of Lower Silesia until in 1248 his younger brother Henry III the White came of age and claimed his rights of succession. Backed by the nobility of Wrocław, Henry III forced the duke to cede central parts of Lower Silesia to him, while Bolesław himself retired to Legnica. Furthermore, he came into conflict with his younger brother Konrad, who, originally predestined for an ecclesiastical career as Bishop of Passau, also demanded his distributive share and had to be paid off by Bolesław with the newly created Duchy of Głogów in 1251.
Nevertheless, Bolesław's son Henry V the Fat, who succeeded his father in 1278, was able to enlarge the duchy's territories by defeating his cousin Henry Probus, Duke of Wrocław, and, with support of King Wenceslaus II of Bohemia succeeded him as duke in 1290. Thus, the Lower Silesian duchies of Legnica and Wrocław were re-reunited until 1311.
As after the death of Henry V in 1296 his eldest son Bolesław III the Generous was still a minor, King Wenceslaus took over his guardianship, strengthening the Bohemian influence in Silesia. In 1303 Bolesław III was betrothed to Wenceslaus' daughter Margaret and to no avail tried to follow the extinct Přemyslid dynasty on the Bohemian throne in 1306. He was not able to retain the united duchy and in 1311 Lower Silesia was split again, with Wrocław going to his younger brother Henry VI the Good. Even Bolesław's rule over Legnica was contested by his brother Władysław and in 1329 he had to pay homage to the Bohemian King John of Luxembourg to secure his reign.
As the duchy's capital at the beginning of the 14th century, Legnica was an important city of Central Europe, with a population of approximately 16,000 residents. The city began to expand quickly after the discovery of gold in the Kaczawa.
Piast state from 1329 onwards became a Czech vassal, the political weakness of the duchy continued, caused by domestic conflicts between Bolesław's the Wastefull sons Wenceslaus and Louis the Fair strengthening the influences of the Bohemian monarchs. When in 1419 the Legnica branch of the Silesian Piasts became extinct with the death of Duke Wenceslaus II, the duchy was inherited by Duke Louis II of Brzeg. As Louis himself had no male heirs, Legnica was annexed as a ceased fief by the Bohemian king Sigismund in 1436. A long-standing dispute arose, as the late Duke Louis II had bequeathed his estates to the sons of his step-brother Duke Henry IX of Lubin –though without the consent of the Bohemian overlord. Eventually, in 1455 the duchy was inherited by Frederick I, the son of Louis' daughter Hedwig, who was officially enfeoffed by King Matthias Corvinus in 1469.
Frederick's son Frederick II, Duke from 1499, again inherited the Duchy of Brzeg in 1520. The Protestant Reformation was introduced in the duchy as early as 1522, decisively promoted by the theologians Caspar Schwenckfeld and Valentin Krautwald, and the population quickly turned Lutheran. This led to conflict when, after the death of the Bohemian King Louis II at the Battle of Mohács in 1526, the Lands of the Bohemian Crown including the Legnica fief were incorporated into the Habsburg monarchy of the Catholic king Ferdinand. In turn, Duke Frederick II signed an inheritance pact with the Hohenzollern elector Joachim II Hector of Brandenburg, a cousin of his second wife Sophia. However, King Ferdinand I, rejecting any Hohenzollern influence within the Habsburg lands, declared the agreement null and void.
The struggles continued, though the duchy was officially guaranteed freedom of religion by the 1648 Peace of Westphalia. After the death of the last Piast duke, George William, in 1675, Legnica passed to the direct rule of the Habsburg emperor Leopold I, despite claims raised by Elector Frederick William of Brandenburg referring to the inheritance pact in 1537. For the Prussian king Frederick the Great, the old dispute was a pretext to justify his campaign during the First Silesian War: in 1742 most of Silesia including Legnica was occupied by the Prussian Army after Empress Maria Theresa's defeat in the War of the Austrian Succession. Finally in 1763 the duchy lost most of its privileges after being incorporated into Prussia according to the Peace of Hubertusburg.
Please note all items auctioned are genuine, we do not sell reproductions. A Certificate of Authenticity (COA) can be issued on request.
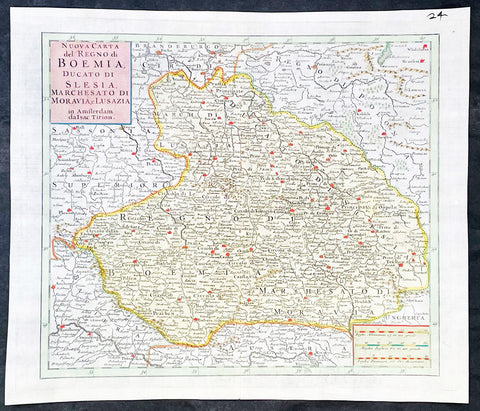
1740 Isaac Tirion Antique Map of Bohemia, Silesia, Moravia - Germany, Poland
Antique Map
- Title : Nuova Carta del Regno di Boemia Ducato Di Slesia, Marches Ato Di Moravia e lusazia in Amsterdam da Isac Tirion
- Ref #: 35636
-
Condition: (A+) Fine Condition
- Size: 14 1/2in x 12 1/2in (365mm x 315mm)
- Date : 1740
- Price: $149US
Description:
This original hand coloured copper plate engraved antique map of the central European countries of the Kingdom of Bohemia, Duchy of Silesia, Marquisate of Moravia, and Lusatia by Isaac Tirion, was published in 1740 in Amsterdam.
General Definitions:
Paper thickness and quality: - Heavy and stable
Paper color : - off white
Age of map color: - Original
Colors used: - Yellow, green, blue, pink
General color appearance: - Authentic
Paper size: - 14 1/2in x 12 1/2in (365mm x 315mm)
Plate size: - 12 1/2in x 10 1/2in (315mm x 265mm)
Margins: - Min 1in (25mm)
Imperfections:
Margins: - None
Plate area: - None
Verso: - None
Background:
Bohemia is the westernmost and largest historical region of the Czech Republic. Bohemia can also refer to a wider area consisting of the historical Lands of the Bohemian Crown ruled by the Bohemian kings, including Moravia and Czech Silesia, in which case the smaller region is referred to as Bohemia proper as a means of distinction
Please note all items auctioned are genuine, we do not sell reproductions. A Certificate of Authenticity (COA) can be issued on request.
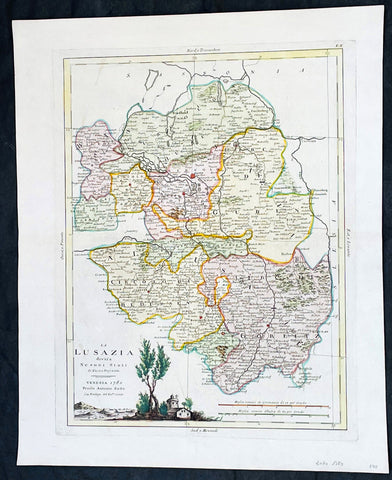
1780 Antonio Zatta Antique Map of The Lusatia Region Germany, Poland & Czech Rep
Antique Map
- Title : La Lusazia divisa ne suoi stati di nuova projezione
- Ref #: 35638
-
Condition: (A+) Fine Condition
- Size: 19in x 15 1/2in (485mm x 395mm)
- Date : 1780
- Price: $149US
Description:
This original hand coloured copper plate engraved antique map of the ancient central European region of Lusatia in between Poland and Germany, and in the south, the Czech Republic by Antonio Zatta (fl. 1775-97) in 1780 - dated - was published in his Atlas Atlante Novissimo
General Definitions:
Paper thickness and quality: - Heavy and stable
Paper color : - off white
Age of map color: - Original
Colors used: - Yellow, green, blue, pink
General color appearance: - Authentic
Paper size: - 19in x 15 1/2in (485mm x 395mm)
Plate size: - 16in x 12 1/2in (405mm x 315mm)
Margins: - Min 1in (25mm)
Imperfections:
Margins: - None
Plate area: - None
Verso: - None
Background:
Lusatia is a historical region in Central Europe, split between Germany and Poland. Lusatia stretches from the Bóbr and Kwisa rivers in the east to the Pulsnitz and Black Elster rivers in the west, and is located within the German states of Saxony and Brandenburg as well as in the Polish voivodeships of Lower Silesia and Lubusz. Lusatia's central rivers are the Spree and the Lusatian Neisse, which constitutes the border between Germany and Poland since 1945 (Oder–Neisse line). The Lusatian Mountains (part of the Sudetes), separate Lusatia from Bohemia (Czech Republic) in the south. Lusatia is traditionally divided into Upper Lusatia (the hilly southern part) and Lower Lusatia (the flat northern part).
Please note all items auctioned are genuine, we do not sell reproductions. A Certificate of Authenticity (COA) can be issued on request.
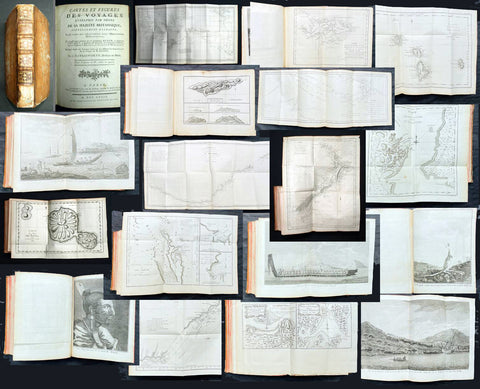
1774 Cook & Hawkesworth Antique Atlas of Australia, New Zealand 52 Maps & Prints
Antique Map
- Title : Cartes et figures des voyages entrepris par ordre de sa Majesté Britannique, actuellement régnante ; pour faire des découvertes dans l'hémisphère méridional, et successivement exécutés par le Commodore Byron, le Capitaine Carteret, le Capitaine Wallis & le Capitaine Cook dans les vaisseaux. MDCCLXXIV (1774)
- Size: 4to (Quatro)
- Condition: (A) Very Good Condition
- Date : 1774
- Ref #: 35632
Description:
This original antique Atlas containing 52 maps and prints, as called for, from some of the foremost explorers of the mid 18th century, including Commodore Byron, Captain Carteret, Captain Wallis & Captain James Cook, was published as the 1st French edition of Cartes et figures des voyages entrepris par ordre de sa Majesté Britannique: (Maps and Figures of Travels undertaken by Order of his Present Reigning British Majesty) in 1774, published after only a year after the 1st English edition by John Hawkesworth.
The 52 prints and maps contained in this atlas chart in maps, prints and plans, the progression in the exploration of the South Seas of the 4 explorers. But there is of course, the standout amongst these 4 explorers and that is of course Captain James Cook.
At the time of the publication of this tome, Cook had returned from his first voyage of exploration to The South Pacific, becoming the first European to survey and chart the coastline of New Zealand and the east coast of Australia. But at this point Cook was not as famous as he was destined to become, after completing 2 more voyages of exploration, and in turn becoming the most famous explorer of his era.
The majority of this atlas contains the prints and maps dedicated to Cooks 1st Voyage of Discovery including the two famous maps, one of New Zealand and the other the East Coast of Australia. All voyages can be tracked from the first large folding map of the South Seas, at the beginning of the Atlas, that illustrates the tracks on Cook and the other 3 explorers.
In-4 binding in half-calf, spine with five bands with gilding boxes and title label complete with 52 folding & single plates
Spine & boards in poor condition with lack of leather and scratched covers, contents tights with plates in very good condition.
General Definitions:
Paper thickness and quality: - Heavy and stable
Paper color : - off white
Age of map color: -
Colors used: -
General color appearance: -
Paper size: - 4to (Quatro)
Plate size: - 4to (Quatro)
Margins: - 4to (Quatro)
Imperfections:
Margins: - Light age toning - Maps & Prints
Plate area: - Folds as issued - Maps & Prints
Verso: - Folds as issued - Maps & Prints
Background:
Capt. Cook First Voyage 1768 - 1771:
In 1768 Cook was chosen to lead an expedition to the South Seas to observe the Transit of Venus and to secretly search for the unknown Great Southern Continent (terra australis incognita).
Cook and his crew of nearly 100 men left Plymouth (August 1768) in the Endeavour and travelled via Madeira (September), Rio de Janiero (November-December) and Tierra del Fuego (January 1769) to Tahiti.
At Tierra del Fuego (January 1769) Cooks men went ashore and met the local people whom Cook thought perhaps as miserable a set of People as are this day upon Earth. Joseph Bankss party collected botanical specimens but his two servants, Thomas Richmond and George Dorlton, died of exposure in the snow and cold. Leaving Tierra del Fuego Endeavour rounded Cape Horn and sailed into the Pacific Ocean.
Sir Joseph Banks wrote about the homes of the Fuegans
..…huts or wigwams of the most unartificial construction imaginable, indeed no thing bearing the name of a hut could possibly be built with less trouble. They consisted of a few poles set up and meeting together at the top in a conical figure, these were covered on the weather side with a few boughs and a little grass, on the lee side about one eighth part of the circle was left open and against this opening was a fire made.......(Banks, Journal I, 224, 20th January 1769)
Samuel Wallis on the ship Dolphin discovered Tahiti in 1767. He recommended the island for the Transit of Venus observations and Cook arrived here in April 1769. Cook, like Wallis two years before him, anchored his ship in the shelter of Matavai Bay on the western side of the island.
In Matavai Bay Cook established a fortified base, Fort Venus, from which he was to complete his first task – the observation of the Transit of Venus (3rd June 1769). The fort also served as protection for all the important scientific and other equipment which had to be taken ashore as:
.......great and small chiefs and common men are firmly of opinion that if they can once get possession of an thing it immediately becomes their own…the chiefs employd in stealing what they could in the cabbin while their dependents took every thing that was loose about the ship…...(Joseph Banks).
Theft by some native peoples plagued Cooks voyages.
Cook and his crew experienced good relations with the Tahitians and returned to the islands on many occasions, attracted by the friendly people of this earthly paradise. On arrival Cook had set out the rules, including:
.....To endeavour by every fair means to cultivate a friendship with the Natives and to treat them with all imaginable humanity....
Just as Cook was planning to leave Tahiti two members of Endeavours crew decided to desert, having strongly attached themselves to two girls, but Cook recovered them.
Cook sailed around the neighbouring Society Islands and took on board the Tahitian priest, Tupaia, and his servant, Taiata. Endeavour left the Society Island in August 1769.
Tupaia acted as interpreter when they came into contact with other Polynesian peoples and helped Cook to make a map of the Pacific islands. This showed Cook the location of islands arranged according to their distance from Tahiti and indicated Tupaias and Polynesian knowledge of navigation and their skill as great mariners.
Cook sailed in search of the Southern Continent (August-October 1769) before turning west to New Zealand. The first encounters with the native Maori of New Zealand in October were violent, their warriors performing fierce dances, or hakas, in attempts to threaten and challenge the ships crew. Some of their warriors were killed when Cooks men had to defend themselves. Eventually relations improved and Cook was able to trade with the Maori for fresh supplies.
Exploring different bays and rivers along the way Cook circumnavigated New Zealand and was the first to accurately chart the whole of the coastline. He discovered that New Zealand consisted of two main islands, north (Te Ika a Maui) and south (Te Wai Pounamu) islands (October 1769-March 1770).
The artist Sydney Parkinson described three Maori who visited the Endeavour on 12th October 1769:
......Most of them had their hair tied up on the crown of their heads in a knot…Their faces were tataowed, or marked either all over, or on one side, in a very curious manner, some of them in fine spiral directions…
This Maori wears an ornamental comb, feathers in a top-knot, long pendants from his ears and a heitiki, or good luck amulet, around his neck.
At the northern end of the south island Cook anchored the ship in Ship Cove, Queen Charlotte Sound, which became a favourite stopping place on the following voyages. Parkinson noted:
......The manner in which the natives of this bay (Queen Charlotte Sound) catch their fish is as follows: - They have a cylindrical net, extended by several hoops at the bottom, and contracted at the top; within the net they stick some pieces of fish, then let it down from the side of the canoe and the fish, going in to feed, are caught with great ease.....(Parkinson, Journal, 114)
In Queen Charlottes Sound Cook visited one of the many Maori hippah, or fortified towns.
........The town was situated on a small rock divided from the main by a breach in a rock so small that a man might almost Jump over it; the sides were every where so steep as to render fortifications iven in their way almost totally useless, according there was nothing but a slight Palisade…in one part we observed a kind of wooden cross ornamented with feathers made exactly in the form of a crucifix cross…we were told that it was a monument to a dead man.......
Endeavour left New Zealand and sailed along the east coast of New Holland, or Australia, heading north (April-August 1770). Cook started to chart the east coast and on 29th April landed for the first time in what Cook called Stingray, later, Botany Bay.
The ship struck the Great Barrier Reef and was badly damaged (10 June). Repairs had to be carried out in Endeavour River. (June-August 1770). The first kangaroo to be sighted was recorded and shot.
The inhabitants of New Holland were very different from the people Cook had come across in other Pacific lands. They were darker skinned than the Maori and painted their bodies:
......They were all of them clean limnd, active and nimble. Cloaths they had none, not the least rag, those parts which nature willingly conceals being exposed to view compleatly uncovered......(Joseph Banks)
Tupaia could not make himself understood and at first the aborigines were very wary of the visitors and not at all interested in trading.
Joseph Banks recorded the fishing party observed at Botany Bay on 26 April 1770. He wrote:
......Their canoes… a piece of Bark tied together in Pleats at the ends and kept extended in the middle by small bows of wood was the whole embarkation, which carried one or two…people…paddling with paddles about 18 inches long, one of which they held in either hand.....(Banks, Journal II, 134)
Endeavour left Australia and sailed via the Possession Isle and Endeavour Strait for repairs at Batavia, Java (October-December 1770). Although the crew had been quite healthy and almost free from scurvy, the scourge of sailors, many caught dysentery and typhoid and over thirty died at Batavia or on the return journey home via Cape Town, South Africa (March-April 1771). The ship arrived off Kent, England (July 1771).
The voyage successfully recorded the Transit of Venus and largely discredited the belief in a Southern Continent. Cook charted the islands of New Zealand and the east coast of Australia and the scientists and artists made unique records of the peoples, flora and fauna of the different lands visited.
Vice-Admiral John Byron (1723-1786) was a British naval officer and explorer. He is known for his circumnavigation of the globe aboard the HMS Dolphin, completing one of the first British expeditions to achieve this feat. His account of the voyage, "The Narrative of the Honourable John Byron," influenced subsequent explorations. Byron's naval career included service in the Seven Years' War and the American Revolutionary War.
Rear-Admiral Philip Carteret (1733-1796) was a British naval officer and explorer. He is best known for his role as the captain of HMS Swallow during the first circumnavigation of the globe. Carteret's expedition, which took place from 1766 to 1769, aimed to explore and map uncharted regions of the Pacific Ocean. His discoveries included the Carteret Islands and the Pitcairn Islands. Carteret's voyage greatly contributed to the knowledge of Pacific geography and exploration during that time.
Samuel Wallis (1728-1795) was a British naval officer and explorer. He is renowned for leading the first recorded European expedition to visit Tahiti and for his significant contributions to the exploration of the Pacific Ocean. In 1766, Wallis commanded HMS Dolphin on a voyage funded by the British Admiralty. During the expedition, he discovered and named several islands, including Tahiti, which he encountered in June 1767. Wallis's visit to Tahiti marked the beginning of sustained European contact with the island and its inhabitants. His exploration efforts and subsequent reports greatly expanded European knowledge of the Pacific region. Wallis's achievements laid the foundation for future explorations and influenced subsequent voyages of exploration in the Pacific.
John Hawkesworth 1715 -1775
An English writer and journalist, Hawkesworth was commissioned by the British Admiralty to edit for publication the narratives of its officers circumnavigations. He was given full access to the journals of the commanders and the freedom to adapt and re-tell them in the first person. Cook was already on his way back from his second Pacific voyage, temporarily docked at Cape Town (South Africa), when he first saw the published volumes: he was mortified and furious to find that Hawkesworth claimed in the introduction that Cook had seen and blessed (with slight corrections) the resulting manuscript. (In his defense, Hawkesworth also had been a victim of misunderstanding.) Cook had trouble recognizing himself. Moreover, the work was full of errors and commentary introduced by Hawkesworth and, in Cooks view, too full of Banks, who had promoted himself and the publication. Still, the work was popular; the first edition sold out in several months.
Cook , Capt. James 1728-1779
James Cook was born on 27 October 1728 in Marton, England. His father was a poor farm labourer who had worked his way up to Overseer. James began as a farm labourer and grocer\\\'s assistant. He soon found employment on the Baltic sea in a Collier (coal transport ship) at the age of 18.
During the war with the French in 1755, James Cook enlisted as an Able Seaman on the Eagle. Within a month he was promoted, because of outstanding ability, to Masters Mate. Four years later he was promoted to Master. In command of his own ship, James Cook performed a crucial charting of the St. Lawrence River, which made possible the great amphibious assault upon Quebec City in 1759. In 1763 he was given command of the schooner Grenville to survey the eastern coasts of Canada over a four year period. These excellent charts were used up until the early part of the 20th century.
James Cook was selected to lead a 1768 expedition to observe the transit of Venus, and to explore new lands in the Pacific Ocean. In his first Pacific voyage, James Cook rounded Cape Horn in the Endeavour and reached Tahiti on 3 June 1769. After recovering a necessary scientific instrument stolen by the natives, the transit of Venus was successfully observed. The Endeavour then spent six months charting New Zealand. James Cook next explored and claimed possession of eastern Australia. Returning to England, on 12 June 1771, via New Guinea, Java and the Cape of Good Hope, the crew suffered an appalling 43% fatality rate. James Cook thus became very concerned about crew health on subsequent voyages. He instituted compulsory dietary reforms that were copied by many other ship captains.
The object of Captain Cook\\\'s second Pacific Ocean voyage was to confirm the existence of a theorized Great Southern Continent. His ship the Resolution, accompanied by the Adventure, departed Plymouth on 13 July 1772 and sailed around the Cape of Good Hope. Beset by ice, he was unable to reach Antarctica. Although its existence was suspected, James Cook demonstrated, by traversing large areas of the south Pacific, that it would have to be a frigid wasteland, and not an economically productive addition to the British empire. James Cook charted many of the South Pacific islands with the incredible accuracy of 3 miles. This accuracy was made possible by a new and highly accurate clock. The two ships returned to England, via Cape Horn, on 29 July 1775. The experimental diets and close attention to cleanliness had a miraculous effect: out of a crew of 118, only one man was lost to disease! Since public interest was high, the many paintings by the artists were widely displayed and published as engravings. James Cook was also awarded the Copley Gold Medal and elected as a fellow of the Royal Society.
The third great voyage is especially significant to the history of the west coast of North America. Captain Cook and his men were primarily searching for the Northwest Passage from the Pacific Ocean to the Atlantic Ocean. They departed Plymouth on 12 July 1776 in the Resolution and the Discovery.
The ships sailed around the Cape of Good Hope to reach the west coast of America in February of 1778. They continued north along the coast in haste to the Bering Sea and Bering Strait in an attempt to pass through the Arctic Ocean during the summer season. Foiled by ice, James Cook returned to Hawaii to prepare for another attempt at the Northwest Passage the next season. Soon after they had departed, a storm damaged the foremast of the Resolution and forced a return to Kealakekua Bay for repairs. Unfortunately, they had previously overstayed their welcome and relations became tense. The theft of a ship\\\'s cutter led Captain Cook to put ashore to demand the return of the boat. A fight broke out and James Cook was killed on 14 Feb 1779 by angry natives. Although his men made another attempt at the Northwest Passage, they were unsuccessful. The expedition did identify the possibilities of trade with the coastal American natives for otter seal furs, which could then be bartered for Chinese goods that were highly prized in England.
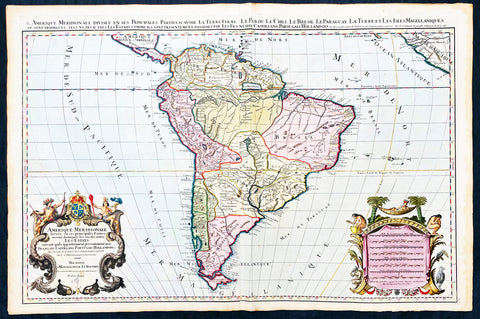
1691 Alex Jaillot Large Antique Map of South America, Gold Imperial Highlights
Antique Map
- Title : Amerique Meridionale Divisee en ses Principales Parties...1691
- Ref #: 35630
- Condition: (A+) Fine Condition
- Size: 37 1/2in x 24 3/4in (940mm x 630mm)
- Date: 1691
Description:
This original beautifully hand coloured (with gold highlights) antique very large map of South America was engraved in 1691 - dated in Cartouche - and was published by Hubert Jaillot in his monumental Atlas Nouveau.
This map is beautifully hand coloured with gold highlights along country borders and the cartouches indicating it was once part of an Imperial Atlas.
The Imperial atlases were hand coloured using gold highlights and other rare colours which at the time was extremely expensive and available at the time only to royalty and the very rich.
General Definitions:
Paper thickness and quality: - Heavy and stable
Paper color : - Off white
Age of map color: - Original
Colors used: - Yellow, green, blue, pink, blue, gold
General color appearance: - Authentic
Paper size: - 37 1/2in x 24 3/4in (940mm x 630mm)
Plate size: - 35 1/2in x 23in (900mm x 590mm)
Margins: - Min 1in (25mm)
Imperfections:
Margins: - Age toning along margins
Plate area: - Crease along centerfold
Verso: - None
Background:
The map include lines of latitude and longitude, some topographical details, location of settlements, rivers, and lakes (including the lakes Parime, thought to be where the fabulous El Dorado was located) as well as the boundaries of the possessions of the European claimants to South America.
Extremely decorative cartouche with dedication to Le Dauphin, and his coat of arms in top.
After Nicolas Sanson, Hubert Jaillot and Pierre Duval were the most important French cartographers of the seventeenth & eighteenth centuries. Jaillot, originally a sculptor, became interested in geography after his marriage to the daughter of Nicolas Berey (1606-65), a famous map colourist, and went into partnership in Paris with Sanson's sons. There, from about 1669, he undertook the re-engraving, enlarging and re-publishing of the Sanson maps in sheet form and in atlases, sparing no effort to fill the gap in the map trade left by the destruction of Blaeu's printing establishment in Amsterdam in 1672. Many of his maps were printed in Amsterdam (by Pierre Mortier) as well as in Paris. One of his most important works was a magnificent sea atlas, Le Neptune François, published in 1693 and compiled in co-operation with J D Cassini. This was re-published shortly afterwards by Pierre Mortier in Amsterdam with French, Dutch and English texts, the charts having been re-engraved. Eventually, after half a century, most of the plates were used again as the basis for a revised issue published by J N Bellin in 1753.(Ref: Tooley; M&B)
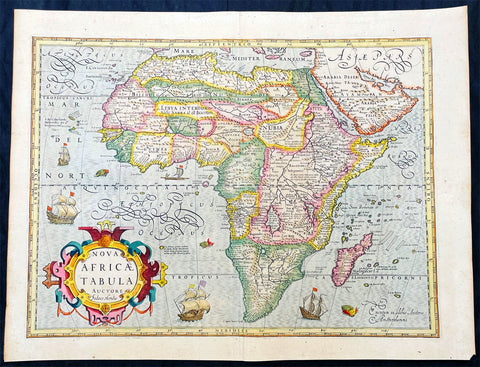
1628 Jodocus Hondius & Gerard Mercator Antique Map of Africa - Beautiful
Antique Map
- Title : Nova Africae Tabula. Auctore Jodoco Hondio Excusum in aedibus Auctoris Amsterodami.
- Ref #: 35626
- Condition: (A+) Fine Condition
- Size: 22 1/2in x 17 1/4in (615mm x 530mm)
- Date: 1628
Description:
This original beautifully hand coloured copper plate engraved antique map of Africa by Jodocus Hondius, after Gerard Mercator, was published in the 1628 Latin edition of Mercators Atlas Atlas Sive Cosmographicae Meditationes De Fabrica Mundi
This is a beautiful map with original hand colouring, heavy age toned paper with a deep impression. Beautiful map.
General Definitions:
Paper thickness and quality: - Heavy and stable
Paper color : - Off white
Age of map color: - Original
Colors used: - Yellow, green, blue, pink
General color appearance: - Authentic
Paper size: - 22 1/2in x 17 1/4in (615mm x 530mm)
Plate size: - 20in x 15in (510mm x 385mm)
Margins: - Min 1/2in (12mm)
Imperfections:
Margins: - None
Plate area: - None
Verso: - None
Background:
Being part of the Mediterranean world, the northern coasts of the African continent as far as the Straits of Gibraltar and even round to the area of the Fortunate Isles (the Canaries) were reasonably well known and quite accurately mapped from ancient times. In particular, Egypt and the Nile Valley were well defined and the Nile itself was, of course, one of the rivers separating the continents in medieval T-O maps. Through Arab traders the shape of the east coast, down the Red Sea as far as the equator, was also known but detail shown in the interior faded into deserts with occasional mountain ranges and mythical rivers. The southern part of the continent, in the Ptolemaic tradition, was assumed to curve to the east to form a land-locked Indian Ocean. The voyages of the Portuguese, organized by Henry the Navigator in the fifteenth century, completely changed the picture and by the end of the century Vasco da Gama had rounded the Cape enabling cartographers to draw a quite presentable coastal outline of the whole continent, even if the interior was to remain largely unknown for the next two or three centuries.
The first separately printed map of Africa (as with the other known continents) appeared in Munster\'s Geographia from 1540 onwards and the first atlas devoted to Africa only was published in 1588 in Venice by Livio Sanuto, but the finest individual map of the century was that engraved on 8 sheets by Gastaldi, published in Venice in 1564. Apart from maps in sixteenth-century atlases generally there were also magnificent marine maps of 1596 by Jan van Linschoten (engraved by van Langrens) of the southern half of the continent with highly imaginative and decorative detail in the interior. In the next century there were many attractive maps including those of Mercator/Hondius (1606), Speed (1627), Blaeu (1 630), Visscher (1636), de Wit (c. 1670), all embellished with vignettes of harbours and principal towns and bordered with elaborate and colourful figures of their inhabitants, but the interior remained uncharted with the exception of that part of the continent known as Ethiopia, the name which was applied to a wide area including present-day Abyssinia. Here the legends of Prester John lingered on and, as so often happened in other remote parts of the world, the only certain knowledge of the region was provided by Jesuit missionaries. Among these was Father Geronimo Lobo (1595-1678), whose work A Voyage to Abyssinia was used as the basis for a remarkably accurate map published by a German scholar, Hiob Ludolf in 1683. Despite the formidable problems which faced them, the French cartographers G. Delisle (c. 1700-22), J. B. B. d\'Anville (1727-49) and N. Bellin (1754) greatly improved the standards of mapping of the continent, improvements which were usually, although not always, maintained by Homann, Seutter, de Ia Rochette, Bowen, Faden and many others in the later years of the century.
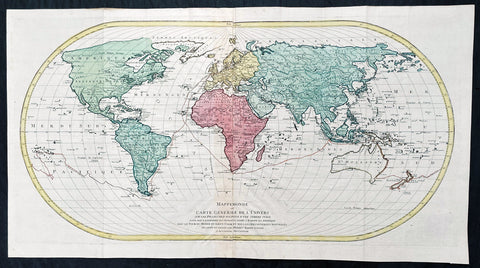
1778 Matthaus Lotter Large Oval World Map showing Capt Cooks 1st Voyage - Rare 1st edition
Antique Map
- Title : Mappe Monde ou carte generale de l`Univers sur une projection nouvelle d`une sphere ovale pour mieux entendre les distances entre l`Europe et Amerique avec le tour du monde du Lieut Cook et Tous Les Decouvertes Nouvelles...MDCCLXXVIII
- Date : 1778 (1st edition)
- Condition: (A+) Fine Condition
- Ref: 35629
- Size: 39in x 21in (990mm x 535mm)
Description:
This very large, impressive original copper-plate engraved antique World Map, on an Ortelius Oval Projection, showing the tracks of Captain Cooks 1st Voyage to the South Seas, was engraved and published by Matthäus Albrecht Lotter in 1778, dated in title. The map was re-issued in 1782 & 1787 to include the tracks of Cooks 2nd & 3rd voyages of discovery.
This 1st edition Lotter Oval map is scarce with only a small few available on the open market.
This map was one of the first world maps published to cash in on the publicity over Captain James Cooks Circumnavigation of the world and the first European survey of New Zealand and the East Coast of Australia. Beautifully executed and dominated by New Holland, Australia, for the first time almost complete on a world map.
General Definitions:
Paper thickness and quality: - Heavy and stable
Paper color : - off white
Age of map color: - Original
Colors used: - Yellow, green, pink
General color appearance: - Authentic
Paper size: - 39in x 21in (990mm x 535mm)
Plate size: - 37 1/2in x 19 1/4in (955mm x 495mm)
Margins: - Min 1in (25mm)
Imperfections:
Margins: - None
Plate area: - Folds as issued
Verso: - None
Background:
This large world map was one of the first to show the discoveries of the east coast of Australia and New Zealand by James Cook on his first voyage of Discovery. The shadow line from Tasmania west to Western Australia was not filled in until the later discoveries of Bass Strait by Bass and Matthew Flinders in 1797 and the southern coast by Baudin and Flinders in 1803. Also included along the New Holland coastline is the earlier Dutch discoveries of Hartog 1616, the van Leeuwin 1619, Nuyts 1627, de Wit 1628 and Tasman 1642-44. The Trial Islands near present-day Dampier, named after the English ship the Trial, which were incorrectly charted by Gerritsz after the false reports provided by Captain Brookes, are also noted.
Cooks First Voyage (1768-1771)
The first voyage under Captain James Cooks command was primarily of a scientific nature. The expedition on HMS Endeavour initially sailed to Tahiti to observe the transit of the planet Venus in order to calculate the earths distance from the sun. Cook landed on the South Pacific island in April of 1769 and in June of that year the astronomical observations were successfully completed. In addition to these labors, very good relations with the Tahitians were maintained and the naturalists Joseph Banks and Daniel C. Solander conducted extensive ethnological and botanical research.
Another purpose of the voyage was to explore the South Seas to determine if an inhabitable continent existed in the mid-latitudes of the Southern Hemisphere. Upon leaving Tahiti, Cook named and charted the Society Islands and then continued southwest to New Zealand. His circumnavigation and exploration of that country also resulted in a detailed survey. Cook proceeded to Australia, where he charted the eastern coast for 2,000 miles, naming the area New South Wales. As a result of these surveys, both Australia and New Zealand were annexed by Great Britain. In addition to these explorations, the HMS Endeavour returned to England without a single death from scurvy among its men, an historic feat at the time. The combination of these accomplishments brought Cook prominence, promotion, and the opportunity to lead further expeditions.
The Ortelius Oval Projection is a map projection used for world maps largely in the late 16th and early 17th century. It is neither conformal nor equal-area but instead offers a compromise presentation. It is similar in structure to a pseudocylindrical projection but does not qualify as one because the meridians are not equally spaced along the parallels. The projection\'s first known use was by Battista Agnese (flourished 1535–1564) around 1540, although whether the construction method was truly identical to Ortelius\'s or not is unclear because of crude drafting and printing. The front hemisphere is identical to Petrus Apianus\'s 1524 globular projection.
The projection reached a wide audience via the popular map Typus Orbis Terrarum by Abraham Ortelius beginning in 1570. The projection (and indeed Ortelius maps) were widely copied by other mapmakers such as Giovanni Pietro Maffei, Fernando de Solis, and Matteo Ricci.
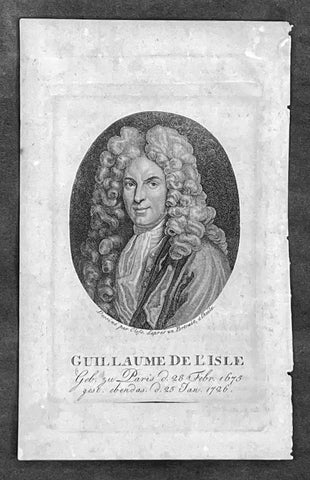
1808 Jean Henri Cless Antique Print of The Cartographer Guillaume Delisle
Antique Map
- Title : Guillaue De L Isle Geb. zu Paris d. 28 Febr. 1675 gest. ebendas d. 25 Jan 1726
- Date : 1808
- Size: 7in x 4 1/2in (180mm x 115mm)
- Condition: (A+) Fine Condition
- Ref: 91417
Description:
This original copper-plate engraved antique print, a portrait of the famous cartographer Guillaume Delisle, by Jean Henri Cless was published in 1808 in Allgemeine Geographische Ephemeriden' (Universal Geographical Ephemerides (i.e. encyclopedia) by Friedrich Bertuch
General Definitions:
Paper thickness and quality: - Heavy and stable
Paper color : - off white
Age of map color: -
Colors used: -
General color appearance: -
Paper size: - 7in x 4 1/2in (180mm x 115mm)
Plate size: - 5 1/2in x 3 1/2in (140mm x 90mm)
Margins: - Min 1/2in (12mm)
Imperfections:
Margins: - None
Plate area: - None
Verso: - None
Background:
Following the long period of Dutch domination, the Homann family became the most important map publishers in Germany in the eighteenth century, the business being founded by J.B. Homann in Nuremberg about the year 1702. Soon after publishing his first atlas in 1707 he became a member of the Berlin academy of Sciences and in 1715 he was appointed Geographer to the Emperor. After the founder's death in 1724, the firm was continued under the direction of his son until 1730 and was then bequeathed to his heirs on the condition that it trades under the name of Homann Heirs. The firm remained in being until the next century and had a wide influence on map publishing in Germany. Apart from the atlases the firm published a very large number of individual maps.
The Homman's produced a Neuer Atlas in 1714, a Grosser Atlas in 1737, and an Atlas Maior with about 300 maps in 1780. They also issued a special Atlas of Germany with full sized plans of principal cities, school atlases and an Atlas of Silesia in 1750 with 20 maps.
Cless, Jean Henri 1774- 1812
A pupil of Jacques-Louis David , he began to be active around 1800 and exhibited in Paris at the Salons from 1804 to 1808.
According to the Thieme-Becker 2 artistic dictionary , he returned to Alsace in 1811 , where many private collections hold his works.
Cless was also a draftsman and miniaturist .
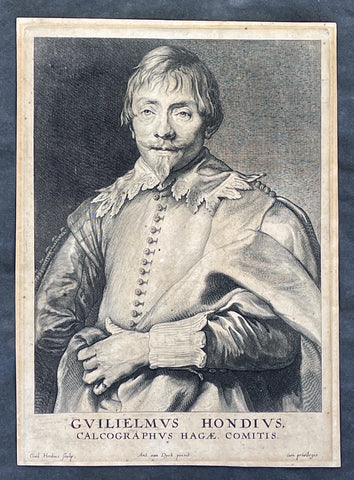
1635 Willem Hondius & Anthony van Dyck Portait of Willem Hondius son of Jodocus
Antique Map
- Title : Guilielmus Hondius, Calcographus Hagae Comitis. Ant. van Dyck pinxit, Guil. Hondius sculp
- Date : 1630-40
- Size: 9 3/4in x 7in (250mm x 180mm)
- Condition: (A) Very Good Condition
- Ref: 91420
Description:
This original copper-plate engraved antique print of Guillaume Hondius, was engraved by himself (Guillaume Hondius) after the famous Flemish painter Anthony van Dyck 1599 - 1641 as part of his Iconographie series of engraved portraits of famous people at the time, between 1630-40.
A wonderfully detailed and charismatic portrait, this exquisite work illustrates the technical mastery and artistic vision of Van Dyck. Guillaume Hondius' stately yet approachable expression reflects Van Dyck's refined ability to comfort and relax his subjects, resulting in a realistic and acute portrait. This piece is intriguing because the subject and the engraver are one and the same, yet the image essentially is still Van Dyck's. Guillaumine Hondius engraves himself through the eyes of Van Dyck, depicted with kind eyes, a broad nose, and a pointy chin. Hondius stands with a calm demeanor, holding up his elaborately draped garment with his left hand and gazing straight out at us.
General Definitions:
Paper thickness and quality: - Heavy and stable
Paper color : - off white
Age of map color: -
Colors used: -
General color appearance: -
Paper size: - 9 3/4in x 7in (250mm x 180mm)
Plate size: - 9 3/4in x 7in (250mm x 180mm)
Margins: - Min 1/2in (12mm)
Imperfections:
Margins: - Age toning
Plate area: - Age toning
Verso: - Dark age toning
Background:
Anthony van Dyck (also spelled van Dyke) was a renowned Flemish Baroque painter born on March 22, 1599, in Antwerp, Belgium, and died on December 9, 1641, in London, England. He is widely regarded as one of the most influential portrait painters of his time, known for his elegant and refined style.
Van Dyck showed great artistic talent from a young age and began his artistic training under the guidance of Hendrick van Balen, a local painter in Antwerp. Recognizing his potential, his parents enrolled him as an apprentice with Peter Paul Rubens, the leading Flemish painter of the time. Van Dyck spent six years in Rubens' studio, absorbing the master's techniques and developing his own skills.
By the age of 19, van Dyck had already established himself as an accomplished artist and was admitted as a master to the Antwerp Guild of Saint Luke. He primarily focused on religious and mythological subjects during his early years, reflecting the influence of Rubens' style. However, van Dyck soon turned his attention to portraiture, a genre that would bring him great success and recognition.
In the early 1620s, van Dyck traveled to Italy, where he spent several years studying the works of Italian Renaissance masters such as Titian and Tintoretto. This period of Italian sojourn greatly influenced his artistic style, leading to a refinement and sophistication in his portraiture. He became particularly renowned for his ability to capture the personality and character of his sitters, employing a sensitive and flattering approach.
Upon his return to Antwerp in 1627, van Dyck's reputation as a portraitist had grown significantly, attracting commissions from aristocrats, nobles, and prominent figures of the time. His portraits exuded a sense of grandeur and elegance, often featuring his subjects in elaborate costumes and settings. Van Dyck's remarkable talent for capturing the likeness and personality of his sitters earned him patrons and clients across Europe.
In 1632, van Dyck was invited to England by King Charles I, who had heard of his remarkable skill as a portrait painter. He was appointed as the court artist and granted a knighthood, becoming Sir Anthony van Dyck. During his time in England, van Dyck produced numerous portraits of the royal family, aristocracy, and influential figures of the British court. His ability to convey grace, poise, and nobility in his subjects revolutionized the art of portraiture in England.
Van Dyck's impact on English art was profound, and he played a crucial role in elevating the status of portrait painting within the art world. His influence extended beyond his lifetime, as many English portraitists were inspired by his style and approach. Van Dyck's legacy can be seen in the works of later artists such as Thomas Gainsborough, Joshua Reynolds, and Thomas Lawrence.
Despite his success, van Dyck's life was plagued by financial troubles and personal difficulties. He led a lavish lifestyle and accumulated significant debts, which he struggled to repay. Moreover, his health deteriorated in his later years, possibly due to the strain of his extensive work. Van Dyck passed away in London at the age of 42, leaving behind a rich artistic legacy.
Anthony van Dyck's mastery of portraiture, characterized by his skillful rendering of his subjects' individuality and his elegant style, has made him one of the most celebrated painters in art history. His works continue to be admired and studied, serving as a testament to his enduring influence and artistic brilliance.
Hondius, Guillaume or Willem (1598/9 - 1658/60)
Willem Hondius was one of seven children of Hendrik Hondius the Elder (1573 – c. 1649) and Sara Jansdochter. His father was one of the most important Dutch reproductive printmakers and publishers in the early 17th century. A connection with the Hondius family of cartographers in Amsterdam is possible but has not been established.
In 1636 Willem visited Danzig in Poland. In 1641 he moved there from The Hague for good. Hondius was supported at the royal court of King Władysław IV Waza. The King awarded him the title of Chalcographus privilegialus (privileged engraver) and Chalcographus Regius (Royal engraver).
He was married twice, first in 1632 in The Hague to Kornelia van den Enden, secondly in 1646 in Danzig to Anna Mackensen, daughter of the Royal Goldsmith.
In August 1651, in the wake of the Khmelnytsky Uprising, Hondius joined the army of Janusz Radziwiłł conquering Kiev. The first ever portrait of the famous Cossack leader Bohdan Khmelnytsky was engraved during this campaign.
Nothing is known of Hondius after 1652, though he may have lived until 1658.
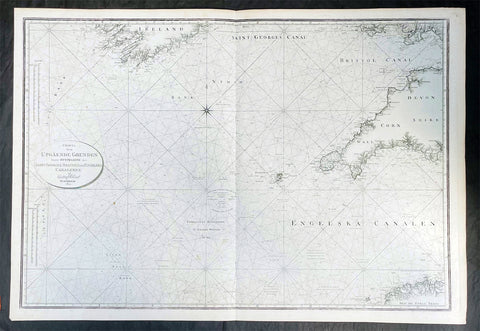
1801 Gustaf Klint Large Map Sea Chart Celtic Sea Ireland to Bristol, Cornwall et
Antique Map
-
Title : Charta ofver Upgaende Grunden Jemte Opningarne Till Saint George, Bristols och Engelska Canalerne Gustaf af Klint Stockholm 1801
- Ref #: 35615
-
Condition: (A+) Fine Condition
- Size: 39 1/2in x 27in (990mm x 685mm)
- Date : 1801
Description:
This very large original copper plate engraved map a sea chart of The Celtic Sea, from southern Ireland to the Bristol Channel, Cornwall & The Scilly Islands was by the Swedish naval officer and cartographer Gustaf af Klint was engraved and published in 1801, dated.
General Definitions:
Paper thickness and quality: - Heavy and stable
Paper color : - off white
Age of map color: -
Colors used: -
General color appearance: -
Paper size: - 39 1/2in x 27in (990mm x 685mm)
Plate size: - 39 1/2in x 27in (990mm x 685mm)
Margins: - Min 1/2in (12mm)
Imperfections:
Margins: - None
Plate area: - None
Verso: - None
Background:
The Celtic Sea is an area of the Atlantic Ocean that stretches from the southern coast of Ireland to the western coast of Brittany in France. It is named after the Celtic culture that was once dominant in the region. The sea is bordered by several countries including Ireland, the United Kingdom, and France. It is a busy shipping route, with commercial vessels transporting goods between ports in Europe and North America. The sea is also important for fishing, with a variety of fish species, such as mackerel, herring, and cod, found in its waters. Additionally, the Celtic Sea is known for its rich marine biodiversity, with numerous species of dolphins, whales, and seabirds inhabiting the area.
Klint, Gustaf af 1774 - 1840
Gustaf af Klint was a Swedish naval officer born on September 14, 1772, in Örebro, Sweden. He began his naval career at the age of 16, joining the Swedish Navy in 1788. Over the years, he served in various positions and rose through the ranks, becoming a captain in 1801.
In addition to his naval career, Gustaf af Klint was also a skilled cartographer. He produced several detailed maps of the Swedish coast and Baltic Sea, which were widely used by sailors and navigators at the time. His maps were known for their accuracy and attention to detail, making them an essential tool for safe navigation in the often treacherous waters of the Baltic Sea.
One of Gustaf af Klint's most significant contributions to cartography was his work on the "Sea Atlas of the Baltic Sea," which he began in 1806. The atlas contained detailed maps of the entire Baltic Sea region, including the coasts of Sweden, Finland, Russia, Estonia, Latvia, and Lithuania. The maps were meticulously drawn, with precise soundings, navigational hazards, and coastal features clearly marked.
Gustaf af Klint retired from the Swedish Navy in 1824, having reached the rank of Rear Admiral. He continued to work on his sea atlas until his death in 1840, leaving behind a lasting legacy as one of Sweden's most accomplished naval officers and cartographers. Today, his maps are considered a valuable historical record of the Baltic Sea region and are sought after by collectors and historians alike.
Please note all items auctioned are genuine, we do not sell reproductions. A Certificate of Authenticity (COA) can be issued on request.
1801 Kinbei Tadamasa Antique Map of Nagasaki & Port, Japan - Nagasaki Zu
Antique Map
- Title : (Nagasaki Zu)
- Date : 1801
- Size: 17 1/2in x 13 1/2in (445mm x 343mm)
- Condition: (A+) Fine Condition
- Ref: 20406
Description:
Incredibly rare original hand coloured wood block engraved antique map of Nagasaki and Port (Nagasaki Zu) Japan by Kinbei Tadamasa was published in 1801.
Kinbei Tadamasa was a Japanese cartographer and publisher who lived in Nagasaki during the Edo period (1603-1868). He was known for his maps of Nagasaki and the surrounding areas, as well as his publications on astronomy and geography.
The Nagasaki Zu map depicts the city of Nagasaki as it appeared in the mid-18th century, including its streets, buildings, and landmarks. The map is oriented with north to the right, and is presented in a bird's-eye view format, which was common for maps of Japanese cities during this time. The map also includes a key to important locations in the city, such as temples, shrines, and government buildings.
Nagasaki Zu is considered an important historical document, as it provides a detailed view of Nagasaki during a time of significant cultural exchange between Japan and the West. Nagasaki was one of the few Japanese ports open to foreign trade during the Edo period, and as a result, it became an important center for the exchange of ideas and goods between Japan, China, and Europe. The map depicts the presence of Western-style buildings and fortifications in the city, reflecting the influence of European and Chinese traders on the local culture.
Today, Nagasaki Zu is held in the collections of several museums and libraries in Japan, including the Nagasaki City Museum and the National Diet Library. It is a valuable resource for scholars and historians studying the history and culture of Nagasaki and Japan during the Edo period.
General Definitions:
Paper thickness and quality: - Heavy and stable
Paper color : - off white
Age of map color: - Original
Colors used: - Blue, yellow, green
General color appearance: - Authentic
Paper size: - 17 1/2in x 13 1/2in (445mm x 343mm)
Plate size: - 17 1/2in x 13 1/2in (445mm x 343mm)
Margins: - Min 0in (0mm)
Imperfections:
Margins: - None
Plate area: - None
Verso: - None
Background:
During the 18th and 19th centuries, Japanese cartographers continued to produce maps of Nagasaki, reflecting the citys growth and changes over time.
One notable example of 18th century Japanese cartography of Nagasaki is the Nagasaki Zu or Map of Nagasaki, created by a Japanese cartographer named Kinbei Tadamasa in 1801. The map was produced using traditional Japanese cartographic techniques and features detailed illustrations of the citys streets, buildings, and landmarks. The map also includes annotations in Japanese, indicating the locations of various temples, shrines, and other landmarks.
Another important map of Nagasaki is the Nagasaki Ezu or Map of Nagasaki, created by a Japanese cartographer named Yamanouchi Tatsunosuke in 1853. The map was produced using a combination of traditional Japanese and Western cartographic techniques and features detailed illustrations of the citys streets, buildings, and waterways. The map also includes annotations in both Japanese and Dutch, indicating the locations of various landmarks and buildings.
In the late 19th century, the Japanese government began to adopt Western-style cartographic techniques, resulting in the production of maps such as the Nagasaki-shi Eiri Chizu or Map of Nagasaki City, created by the Geographical Survey Institute in 1893. The map was produced using a combination of Western and Japanese cartographic techniques and features a more modern, topographical view of the city.
These maps of Nagasaki provide valuable insight into the history and development of the city, as well as the evolution of Japanese cartographic techniques over time. They offer a unique perspective on the citys layout, architecture, and landmarks during the 18th and 19th centuries, reflecting the changes that occurred as Nagasaki became an important center of trade and commerce.
Tadamasa, Kinbei
Kinbei Tadamasa was a Japanese cartographer, astronomer, and publisher who lived in Nagasaki during the Edo period (1603-1868). He was born in 1729 in Nagasaki and worked as a surveyor and astronomer for the Nagasaki Domain. Tadamasa is known for his detailed maps of Nagasaki and its surrounding areas, as well as his publications on astronomy and geography.
In 1775, Tadamasa published his most famous work, "Nagasaki Zu," a detailed map of the city of Nagasaki. The map is oriented with north to the right and presented in a bird's-eye view format, which was common for maps of Japanese cities during this time. It is considered an important historical document as it provides a detailed view of Nagasaki during a time of significant cultural exchange between Japan and the West.
Tadamasa was also a prominent publisher and bookseller, and his shop, Bunkindo, became well known for its publications on astronomy, geography, and literature. Tadamasa's publications were known for their high quality and accuracy, and he was recognized as an important figure in the development of scientific knowledge and cartography in Japan during the Edo period.
Today, Tadamasa's maps and publications are held in the collections of several museums and libraries in Japan, including the Nagasaki City Museum and the National Diet Library. He is considered one of the most important cartographers and publishers of his time, and his work remains an important resource for scholars and historians studying the history and culture of Japan during the Edo period.
Please note all items auctioned are genuine, we do not sell reproductions. A Certificate of Authenticity (COA) can be issued on request.
1742 Henry Popple & George Le Rouge Large Antique Map of Colonial America
Antique Map
- Title : Amerique Septentrionale Suivant la Carte de Pople....A Paris....Le Rouge...1742
- Date : 16742
- Size: 24 1/2in x 22 1/2in (625mm x 570mm)
- Condition: (A) Very Good Condition
- Ref: 27093
Description:
This incredibly important, original hand coloured copper plate engraved antique map of North America by George Le Rouge, after Henry Popples famous North America map, was published in 1742 - dated.
A handsome key sheet from a French edition of the first large-scale map of colonial North America. Among the 18 inset maps along the right border are ones of Bermuda, Boston, New York City, and Charleston. Popple's original, 1733 map ran to 20 sheets, hence the necessity of a key sheet. It was a semi-official undertaking intended to depict for British colonial administrators the respective North American territories of England, France and Spain. This French-published version, as expected, greatly exaggerates French territory at the expense of both England and Spain.
General Definitions:
Paper thickness and quality: - Heavy and stable
Paper color : - off white
Age of map color: - Original & later
Colors used: - Yellow, green, blue, pink
General color appearance: - Authentic
Paper size: - 24 1/2in x 22 1/2in (625mm x 570mm)
Plate size: - 20 3/4in x 19 3/4in (525mm x 500mm)
Margins: - Min 1in (30mm)
Imperfections:
Margins: - Light creasing along margins
Plate area: - Light creasing
Verso: - Re-enforced along centerfold
Background:
In 1730, the English Board of Trade & Plantations issued a request for maps of the British, French, and Spanish territorial claims in the New World, as ongoing boundary conflicts hindered economic development in the colonies. A former employee, Henry Popple, created an incredible 20-sheet map first published in 1733 that covered a broad region between Hudson Bay and the northern coast of South America and inland as far as the Rio Grande. It would become tremendously influential diplomatically as disputes among European powers increased dramatically in subsequent decades.
Accompanying the monumental production was a keymap, seen here as a later French edition issued by Georges Louis Le Rouge in 1742. With the exception of the language, decorative elements, annotations, and a missing vignette in the upper left corner, the image is largely the same as the original. It’s surprisingly accurate, as Popple was studious in his use of the latest available sources, though several geographic features have been enlarged or distorted and a large mysterious lake filled with islands appears near the western edge of the sheet.
It’s likely this is a remnant of the great saline sea speculated by Baron Lahontan, a French military officer who traveled extensively throughout the Great Lakes region from 1684 -1689. He later wrote several popular travel volumes that included reports of a Long (or Longue) River that branched from the Missippi westward, eventually reaching a large salt lake at the foot of a mountain range. The geographic influences of his story would be reflected in subsequent cartographic efforts throughout the 18th and into the early 19th century, and speculation on Lahontan’s travels persists to this day.
Elsewhere in the image, the topography is depicted pictorially and shows a prominent Appalachian Mountain range as well as a curious plateau in Michigan that Lewis Karpinski describes as a “fanciful creation.” Native American and European settlements are identified throughout and geographic features are labeled according to the key in the upper right. Seventeen inset plans of prominent port cities and islands can be seen in the lower right; including Boston, Charleston, New York, St. Augustine, Havana, and Cartagena.
Popple, Henry 1680 - 1743
Henry Popple was a British cartographer active in the early part of the 18th century. Popple was a clerk with the Board of Trade and Plantations, the organization that governed Britain's colonies in America. With his father, grandfather, and brother all being employed the board of trade, the Popple family had a long history of association with the British colonial administration. Popple received his commission as a clerk at the board of trade in 1727, but resigned in the same year. Curiously this is the same year he began work on his signature production, the Popple of North America, he resigned from the board to take a position as the Cashier to Queen Anne. Nonetheless he continued to work on his great maps and a manuscript version of the Popple Map appeared in this very year. Subsequently, Popple continued to update and refine the map until 1733 when it was finally printed. The Board of trade intended the Popple map to be a British response to Delisle's French mapping of North America, which presented boundaries that conflicted with British colonial ambitions. However, since Popple in fact based much of his map on Delisle's superior cartography, he also managed to copy many of the French political boundaries - to the detriment of the Board of Trade and its expansionist intentions. Although Popple's map was never approved by the Board, examples were rushed to each colonial governor and the map played a significant role in the cartographic history of North America. Popple cartographic endeavor began and ended with this singular map however, it significance was such that he must be considered in any list of significant British mapmakers.
George Louis Le Rouge fl. 1740-80
A military engineer by profession, le Rouge took up cartography and over a long period from about 1740 to 1780 produced many attractive works covering a wide range of subjects including plans of fortifications, military campaigns, town plans as well as the more usual atlases and sea charts.
1750 J N Bellin Large Antique World Map on Mercators Projection - 27091
Antique Map
- Title : An Essay of a New and Complet Map Containing the Known Part of the Terrestial Globe by N Bellin....MDDCL
- Date : 1750
- Size: 30 1/2in x 22 1/2in (825mm x 570mm)
- Condition: (A) Very Good Condition
- Ref: 27091
Description:
This large original hand coloured copper-plate engraved antique World Map, on Mercators Projection by Jacques Nicolas Bellin was engraved by Jacobus van der Schley in 1750 - dated in the title - and was published in Dutch/English by Pierre d Hondt, publisher, operated out of the Hague.
General Definitions:
Paper thickness and quality: - Heavy and stable
Paper color : - off white
Age of map color: - Early
Colors used: - Blue, yellow, green, pink
General color appearance: - Authentic
Paper size: - 30 1/2in x 22 1/2in (825mm x 570mm)
Plate size: - 27 1/2in x 20 1/2in (700mm x 520mm)
Margins: - Min 1in (25mm)
Imperfections:
Margins: - Bottom left margin extended from plate -mark
Plate area: - Folds as issued
Verso: - Folds as issued
Background:
First edition of Bellins large mid-18th century world map, published in Paris. This map pre-dates the major world discoveries of the late 18th century including the North West coast of America, the Sandwich Islands, and the Voyages of Capt Cook soon to map the East Coast of Australia & NZ.
This edition is most noteworthy for its marvelous early projection of Australia and New Zealand, each with largely speculative coastlines. Australia is still attached to New Guinea and has several notes of early exploration shown. New Zealand is barely known and with only a portion of its western coastline.
No sign of Antarctica and the NW Coast of America includes the first notes of Russian exploration.
In North America Bellin identifies the semi-mythical civilizations of Quivira and Teguayo, both associated with legends of the Seven Cities of Gold, in what is modern day Utah, California, and Nevada. Along the western coast the strait discovered by Martin Aguilar is noted. Further north still the River of the West (Fl. de l’Ouest) extends from the west coast to the Lake of the Woods (Lac de Bois) and thence via additional waterways to the Great Lakes and the Atlantic. The River of the West appeared in many 18th century maps of the Americas and is reflective of French hopes for a water route from their colonies in Canada and Louisiana to the Pacific. Still further north the coastline becomes extremely vague, in places vanishing altogether. The Aleutians are vaguely rendered according to various sightings by Vitus Jonassen Bering and Aleksei Chirikov in the 1740s and identified as the “Archipel de Nord”.
In the Pacific, various Polynesian Island groups are noted though many are slightly or significantly misplaced. The Solomon Islands are vastly oversized referencing the early 17th claims of Quiros. The other lands discovered and erroneously mapped by Quiros in 1606 and Davis in 1686 during their search of the great southern continent are also noted. Hawaii, as yet undiscovered, is absent. New Zealand is rendered twice though is accurate in its form and position. Australia, here labelled “Nouvelle Holland”, has part of its southern coastline ghosted in and Van Diemen’s Land (Tasmania) is attached to the mainland. The southern coast of New Guinea is similarly ghosted in, suggesting its unexplored state. (Ref: Tooley; M&B)
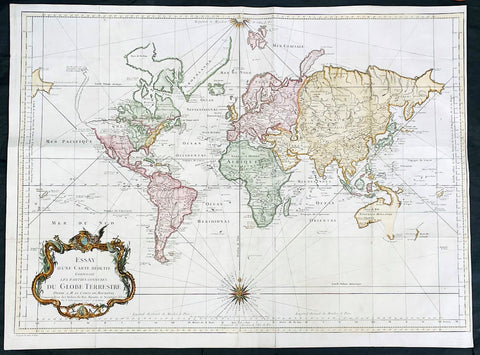
1748 J N Bellin Large Antique World Map on Mercators Projection - 27007
Antique Map
- Title : Essay d une Carte Reduite Contenant les parties connuees Du Globe Terrestre...1748
- Date : 1748
- Size: 28 1/2in x 21in (725mm x 535mm)
- Condition: (A) Very Good Condition
- Ref: 27007
Description:
This large original hand coloured copper-plate engraved antique World Map, on Mercators Projection was engraved in 1748 by Jacques Nicolas Bellin - dated in the title.
General Definitions:
Paper thickness and quality: - Heavy and stable
Paper color : - off white
Age of map color: - Early
Colors used: - Blue, yellow, green, pink
General color appearance: - Authentic
Paper size: - 28 1/2in x 21in (725mm x 535mm)
Plate size: - 26in x 20 1/2in (710mm x 520mm)
Margins: - Min 1/4in (5mm)
Imperfections:
Margins: - Bottom left margin extended from plate -mark
Plate area: - Folds as issued
Verso: - Folds as issued
Background:
First edition of Bellins large mid-18th century world map, published in Paris. This map pre-dates the major world discoveries of the late 18th century including the North West coast of America, the Sandwich Islands, and the Voyages of Capt Cook soon to map the East Coast of Australia & NZ.
This edition is most noteworthy for its marvelous early projection of Australia and New Zealand, each with largely speculative coastlines. Australia is still attached to New Guinea and has several notes of early exploration shown. New Zealand is barely known and with only a portion of its western coastline.
No sign of Antarctica and the NW Coast of America includes the first notes of Russian exploration.
In North America Bellin identifies the semi-mythical civilizations of Quivira and Teguayo, both associated with legends of the Seven Cities of Gold, in what is modern day Utah, California, and Nevada. Along the western coast the strait discovered by Martin Aguilar is noted. Further north still the River of the West (Fl. de l’Ouest) extends from the west coast to the Lake of the Woods (Lac de Bois) and thence via additional waterways to the Great Lakes and the Atlantic. The River of the West appeared in many 18th century maps of the Americas and is reflective of French hopes for a water route from their colonies in Canada and Louisiana to the Pacific. Still further north the coastline becomes extremely vague, in places vanishing altogether. The Aleutians are vaguely rendered according to various sightings by Vitus Jonassen Bering and Aleksei Chirikov in the 1740s and identified as the “Archipel de Nord”.
In the Pacific, various Polynesian Island groups are noted though many are slightly or significantly misplaced. The Solomon Islands are vastly oversized referencing the early 17th claims of Quiros. The other lands discovered and erroneously mapped by Quiros in 1606 and Davis in 1686 during their search of the great southern continent are also noted. Hawaii, as yet undiscovered, is absent. New Zealand is rendered twice though is accurate in its form and position. Australia, here labelled “Nouvelle Holland”, has part of its southern coastline ghosted in and Van Diemen’s Land (Tasmania) is attached to the mainland. The southern coast of New Guinea is similarly ghosted in, suggesting its unexplored state. (Ref: Tooley; M&B)
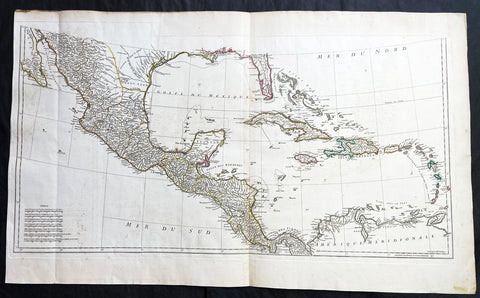
1756 J B D Anville Large Antique Bottom Map Texas, Mexico, Central America - 93518
Antique Map
- Title : (Amerique Septentrionale Publiee sous les Auspices de Monseigneur le Duc d Orleans.. Par Le Snr. D Anville MDCCXLVI)
- Date : 1756
- Size: 36in x 22in (915mm x 560mm)
- Condition: (A+) Fine Condition
- Ref: 93518
Description:
This large important original copper plate engraved antique map, bottom sheets of 4 sheets, of North America was engraved in 1746 and was published by Jean-Baptiste Bourguinon D Anville in his Elephant Folio Atlas Generale. (I have included an image of the map of the map when it is complete)
This map was instrumental in instructing the European Colonial powers of the time, England France & Spain the importance of dominating the New World, that ultimately led to the French and Indian War of 1754–63. This conflict determined the political direction of North America leading to the American War of Independence in 1775 and ultimately the formation of The United States of America.
To illustrate the importance of cartography in the mid eighteenth century, especially that of North America, a J B D Anville map is essential. D Anville dominated 18th century European cartography with many of his cartographical achievements, especially in North America, copied by many of his contemporaries such as Kitchen, Sayer, Homann, Seutter, Mitchell and others .
He was one of the first to leave blank spaces in his maps, where knowledge was scant or insufficient. His representation of the great lakes is superior to that of his contemporary John Mitchell, responsible for publishing one of the most famous mid 18th century maps of North America, A Map of the British and French Dominions in North America on 8 sheets in 1755 and remained the standard map of North America up until the end of the 18th century. (Ref: Tooley, Printed maps of America, 104; The Mapping of America 316)
General Definitions:
Paper thickness and quality: - Heavy and stable
Paper color : - off white
Age of map color: - Original
Colors used: - Yellow, green, blue, pink
General color appearance: - Authentic
Paper size: - 36in x 22in (915mm x 560mm)
Plate size: - 34 1/2in x 17in (880mm x 430mm)
Margins: - Min 1/2in (12mm)
Imperfections:
Margins: - Small right side of margin & border restored
Plate area: - Folds as issued, small dis-colouration to bottom centerfold
Verso: - Folds as issued, several small repairs not affecting image
Background:
The French and Indian War (1754–63) comprised the North American theatre of the worldwide Seven Years War of 1756–63. It pitted the colonies of British America against those of New France. Both sides were supported by military units from their parent countries, as well as by American Indian allies. At the start of the war, the French North American colonies had a population of roughly 60,000 settlers, compared with 2 million in the British North American colonies. The outnumbered French particularly depended on the Indians. The European nations declared war on one another in 1756 following months of localized conflict, escalating the war from a regional affair into an intercontinental conflict.
The name French and Indian War is used mainly in the United States. It refers to the two enemies of the British colonists, the royal French forces and their various American Indian allies. The British colonists were supported at various times by the Iroquois, Catawba, and Cherokee, and the French colonists were supported by Wabanaki Confederacy members Abenaki and Mikmaq, and Algonquin, Lenape, Ojibwa, Ottawa, Shawnee, and Wyandot.
British and other European historians use the term the Seven Years War, as do English-speaking Canadians. French Canadians call it La guerre de la Conquête (the War of the Conquest) or (rarely) the Fourth Intercolonial War.
Fighting took place primarily along the frontiers between New France and the British colonies, from Virginia in the south to Newfoundland in the north. It began with a dispute over control of the confluence of the Allegheny River and Monongahela River called the Forks of the Ohio, and the site of the French Fort Duquesne in Pittsburgh, Pennsylvania. The dispute erupted into violence in the Battle of Jumonville Glen in May 1754, during which Virginia militiamen under the command of 22-year-old George Washington ambushed a French patrol.
In 1755, six colonial governors in North America met with General Edward Braddock, the newly arrived British Army commander, and planned a four-way attack on the French. None succeeded, and the main effort by Braddock proved a disaster; he lost the Battle of the Monongahela on July 9, 1755 and died a few days later. British operations failed in the frontier areas of Pennsylvania and New York during 1755–57 due to a combination of poor management, internal divisions, effective Canadian scouts, French regular forces, and Indian warrior allies. In 1755, the British captured Fort Beauséjour on the border separating Nova Scotia from Acadia, and they ordered the expulsion of the Acadians (1755–64) soon afterwards. Orders for the deportation were given by William Shirley, Commander-in-Chief, North America, without direction from Great Britain. The Acadians were expelled, both those captured in arms and those who had sworn the loyalty oath to His Britannic Majesty. Indians likewise were driven off the land to make way for settlers from New England.
The British colonial government fell in the region of modern Nova Scotia after several disastrous campaigns in 1757, including a failed expedition against Louisbourg and the Siege of Fort William Henry; this last was followed by Indians torturing and massacring their British victims. William Pitt came to power and significantly increased British military resources in the colonies at a time when France was unwilling to risk large convoys to aid the limited forces that they had in New France, preferring to concentrate their forces against Prussia and its allies in the European theater of the war. Between 1758 and 1760, the British military launched a campaign to capture the Colony of Canada (part of New France). They succeeded in capturing territory in surrounding colonies and ultimately the city of Quebec (1759). The British later lost the Battle of Sainte-Foy west of Quebec (1760), but the French ceded Canada in accordance with the Treaty of Paris (1763).
The outcome was one of the most significant developments in a century of Anglo-French conflict. France ceded to Great Britain its territory east of the Mississippi. It ceded French Louisiana west of the Mississippi River (including New Orleans) to its ally Spain in compensation for Spains loss to Britain of Florida. (Spain had ceded Florida to Britain in exchange for the return of Havana, Cuba.) Frances colonial presence north of the Caribbean was reduced to the islands of Saint Pierre and Miquelon, confirming Great Britains position as the dominant colonial power in eastern North America.
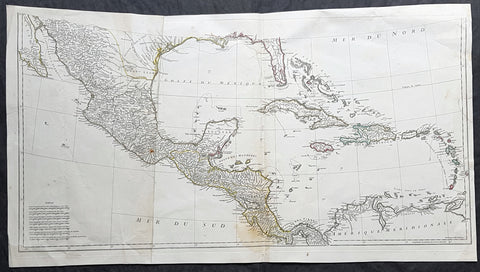
1756 J B D' Anville Large Antique Bottom Map Texas, Mexico, Central America, GOM
Antique Map
- Title : (Amerique Septentrionale Publiee sous les Auspices de Monseigneur le Duc d Orleans.. Par Le Snr. D Anville MDCCXLVI)
- Date : 1756
- Size: 35in x 19in (890mm x 485mm)
- Condition: (A) Very Good Condition
- Ref: 61147
Description:
This large important original copper plate engraved antique map, bottom sheets of 4 sheets, of North America was engraved in 1746 and was published by Jean-Baptiste Bourguinon D Anville in his Elephant Folio Atlas Generale. (I have included an image of the map of the map when it is complete)
This map was instrumental in instructing the European Colonial powers of the time, England France & Spain the importance of dominating the New World, that ultimately led to the French and Indian War of 1754–63. This conflict determined the political direction of North America leading to the American War of Independence in 1775 and ultimately the formation of The United States of America.
To illustrate the importance of cartography in the mid eighteenth century, especially that of North America, a J B D Anville map is essential. D Anville dominated 18th century European cartography with many of his cartographical achievements, especially in North America, copied by many of his contemporaries such as Kitchen, Sayer, Homann, Seutter, Mitchell and others .
He was one of the first to leave blank spaces in his maps, where knowledge was scant or insufficient. His representation of the great lakes is superior to that of his contemporary John Mitchell, responsible for publishing one of the most famous mid 18th century maps of North America, A Map of the British and French Dominions in North America on 8 sheets in 1755 and remained the standard map of North America up until the end of the 18th century. (Ref: Tooley, Printed maps of America, 104; The Mapping of America 316)
General Definitions:
Paper thickness and quality: - Heavy and stable
Paper color : - off white
Age of map color: - Original
Colors used: - Yellow, green, blue, pink
General color appearance: - Authentic
Paper size: - 35in x 19in (890mm x 485mm)
Plate size: - 34 1/2in x 17in (880mm x 430mm)
Margins: - Min 1/2in (12mm)
Imperfections:
Margins: - Small right side of margin & border restored
Plate area: - Folds as issued, small dis-colouration to bottom centerfold
Verso: - Folds as issued, several small repairs not affecting image
Background:
The French and Indian War (1754–63) comprised the North American theatre of the worldwide Seven Years War of 1756–63. It pitted the colonies of British America against those of New France. Both sides were supported by military units from their parent countries, as well as by American Indian allies. At the start of the war, the French North American colonies had a population of roughly 60,000 settlers, compared with 2 million in the British North American colonies. The outnumbered French particularly depended on the Indians. The European nations declared war on one another in 1756 following months of localized conflict, escalating the war from a regional affair into an intercontinental conflict.
The name French and Indian War is used mainly in the United States. It refers to the two enemies of the British colonists, the royal French forces and their various American Indian allies. The British colonists were supported at various times by the Iroquois, Catawba, and Cherokee, and the French colonists were supported by Wabanaki Confederacy members Abenaki and Mikmaq, and Algonquin, Lenape, Ojibwa, Ottawa, Shawnee, and Wyandot.
British and other European historians use the term the Seven Years War, as do English-speaking Canadians. French Canadians call it La guerre de la Conquête (the War of the Conquest) or (rarely) the Fourth Intercolonial War.
Fighting took place primarily along the frontiers between New France and the British colonies, from Virginia in the south to Newfoundland in the north. It began with a dispute over control of the confluence of the Allegheny River and Monongahela River called the Forks of the Ohio, and the site of the French Fort Duquesne in Pittsburgh, Pennsylvania. The dispute erupted into violence in the Battle of Jumonville Glen in May 1754, during which Virginia militiamen under the command of 22-year-old George Washington ambushed a French patrol.
In 1755, six colonial governors in North America met with General Edward Braddock, the newly arrived British Army commander, and planned a four-way attack on the French. None succeeded, and the main effort by Braddock proved a disaster; he lost the Battle of the Monongahela on July 9, 1755 and died a few days later. British operations failed in the frontier areas of Pennsylvania and New York during 1755–57 due to a combination of poor management, internal divisions, effective Canadian scouts, French regular forces, and Indian warrior allies. In 1755, the British captured Fort Beauséjour on the border separating Nova Scotia from Acadia, and they ordered the expulsion of the Acadians (1755–64) soon afterwards. Orders for the deportation were given by William Shirley, Commander-in-Chief, North America, without direction from Great Britain. The Acadians were expelled, both those captured in arms and those who had sworn the loyalty oath to His Britannic Majesty. Indians likewise were driven off the land to make way for settlers from New England.
The British colonial government fell in the region of modern Nova Scotia after several disastrous campaigns in 1757, including a failed expedition against Louisbourg and the Siege of Fort William Henry; this last was followed by Indians torturing and massacring their British victims. William Pitt came to power and significantly increased British military resources in the colonies at a time when France was unwilling to risk large convoys to aid the limited forces that they had in New France, preferring to concentrate their forces against Prussia and its allies in the European theater of the war. Between 1758 and 1760, the British military launched a campaign to capture the Colony of Canada (part of New France). They succeeded in capturing territory in surrounding colonies and ultimately the city of Quebec (1759). The British later lost the Battle of Sainte-Foy west of Quebec (1760), but the French ceded Canada in accordance with the Treaty of Paris (1763).
The outcome was one of the most significant developments in a century of Anglo-French conflict. France ceded to Great Britain its territory east of the Mississippi. It ceded French Louisiana west of the Mississippi River (including New Orleans) to its ally Spain in compensation for Spains loss to Britain of Florida. (Spain had ceded Florida to Britain in exchange for the return of Havana, Cuba.) Frances colonial presence north of the Caribbean was reduced to the islands of Saint Pierre and Miquelon, confirming Great Britains position as the dominant colonial power in eastern North America.
1851 John Tallis Antique Map of Western Australia or The Swan River Settlement
Antique Map
- Title : Western Australia Swan River
- Date : 1851
- Size: 14in x 11in (355mm x 280mm)
- Condition: (A+) Fine Condition
- Ref: 35523
Description:
This original hand coloured, steel plate engraved antique map of Western Australia or The Swan River Settlement, Australia with vignettes of Perth, Fremantle, Aboriginals and settlers was engraved by John Rapkin and published by John Tallis in 1851.
General Definitions:
Paper thickness and quality: - Heavy and stable
Paper color : - off white
Age of map color: - Original
Colors used: - Blue
General color appearance: - Authentic
Paper size: - 14in x 11in (355mm x 280mm)
Plate size: - 14in x 11in (355mm x 280mm)
Margins: - Min 1/2in (12mm)
Imperfections:
Margins: - None
Plate area: - None
Verso: - None
Background:
The firm of Tallis & Company flourished from 1835 to 1860 with varying imprints. Their illustrated Atlas of 1850-51 was one of the last decorative atlases, all the maps being engraved on steel and all adorned with small vignettes. (Ref: Tooley; M&B)
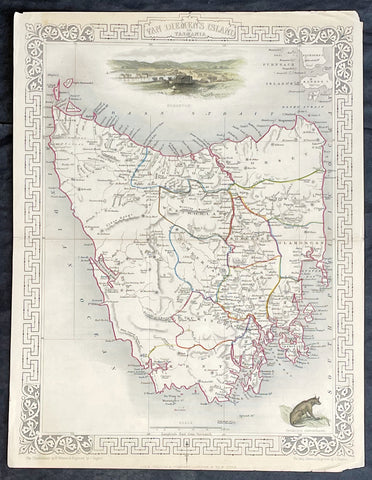
1851 John Tallis Antique Map of Van Diemens Land or Tasmania, Australia
Antique Map
- Title : Van Diemens Land or Tasmania
- Date : 1851
- Size: 14in x 11in (355mm x 280mm)
- Condition: (A+) Fine Condition
- Ref: 35519
Description:
This original hand coloured, steel plate engraved antique map of Tasmania, Australia with vignettes of Hobart and Tasmanian Tiger was engraved by John Rapkin and published by John Tallis in 1851.
General Definitions:
Paper thickness and quality: - Heavy and stable
Paper color : - off white
Age of map color: - Original
Colors used: - Blue
General color appearance: - Authentic
Paper size: - 14in x 11in (355mm x 280mm)
Plate size: - 14in x 11in (355mm x 280mm)
Margins: - Min 1/2in (12mm)
Imperfections:
Margins: - None
Plate area: - None
Verso: - None
Background:
The firm of Tallis & Company flourished from 1835 to 1860 with varying imprints. Their illustrated Atlas of 1850-51 was one of the last decorative atlases, all the maps being engraved on steel and all adorned with small vignettes. (Ref: Tooley; M&B)
1851 John Tallis Antique Map of Victoria or Port Phillip, Australia
Antique Map
- Title : Victoria or Port Phillip
- Date : 1851
- Size: 14in x 11in (355mm x 280mm)
- Condition: (A+) Fine Condition
- Ref: 35503
Description:
This original hand coloured, steel plate engraved antique map of Victoria, Australia with vignettes of Glenelg River, Aboriginals and Kangaroos was engraved by John Rapkin and published by John Tallis in 1851.
General Definitions:
Paper thickness and quality: - Heavy and stable
Paper color : - off white
Age of map color: - Original
Colors used: - Blue
General color appearance: - Authentic
Paper size: - 14in x 11in (355mm x 280mm)
Plate size: - 14in x 11in (355mm x 280mm)
Margins: - Min 1/2in (12mm)
Imperfections:
Margins: - None
Plate area: - None
Verso: - None
Background:
The firm of Tallis & Company flourished from 1835 to 1860 with varying imprints. Their illustrated Atlas of 1850-51 was one of the last decorative atlases, all the maps being engraved on steel and all adorned with small vignettes. (Ref: Tooley; M&B)
1851 John Tallis Antique Map of Australia
Antique Map
- Title : Australia
- Date : 1851
- Size: 14in x 11in (355mm x 280mm)
- Condition: (A+) Fine Condition
- Ref: 35511
Description:
This original hand coloured, steel plate engraved antique map of Australia with vignettes of Sydney Harbour, Aboriginals, Parrots and Kangaroos was engraved by John Rapkin and published by John Tallis in 1851.
General Definitions:
Paper thickness and quality: - Heavy and stable
Paper color : - off white
Age of map color: - Original
Colors used: - Blue
General color appearance: - Authentic
Paper size: - 14in x 11in (355mm x 280mm)
Plate size: - 14in x 11in (355mm x 280mm)
Margins: - Min 1/2in (12mm)
Imperfections:
Margins: - None
Plate area: - None
Verso: - None
Background:
The firm of Tallis & Company flourished from 1835 to 1860 with varying imprints. Their illustrated Atlas of 1850-51 was one of the last decorative atlases, all the maps being engraved on steel and all adorned with small vignettes. (Ref: Tooley; M&B)
1851 John Tallis Antique Map of New South Wales, Australia
Antique Map
- Title : New South Wales
- Date : 1851
- Size: 14in x 11in (355mm x 280mm)
- Condition: (A+) Fine Condition
- Ref: 1554
Description:
This original hand coloured, steel plate engraved antique map of New South Wales, Australia with vignettes of Sydney Harbour and The Murray was engraved by John Rapkin and published by John Tallis in 1851.
General Definitions:
Paper thickness and quality: - Heavy and stable
Paper color : - off white
Age of map color: - Original
Colors used: - Blue
General color appearance: - Authentic
Paper size: - 14in x 11in (355mm x 280mm)
Plate size: - 14in x 11in (355mm x 280mm)
Margins: - Min 1/2in (12mm)
Imperfections:
Margins: - None
Plate area: - None
Verso: - None
Background:
The firm of Tallis & Company flourished from 1835 to 1860 with varying imprints. Their illustrated Atlas of 1850-51 was one of the last decorative atlases, all the maps being engraved on steel and all adorned with small vignettes. (Ref: Tooley; M&B)
1939 Japanese Safety Agency Large Antique Map of Hawaii, Pacific - Pearl Harbor
Antique Map
- Title : North Pacific Ocean Southern Portion Eastern Sheet, Compiled from the United States and the British Charts to 1939
- Date : 1939
- Size: 43in x 30in (1.090m x 760mm)
- Condition: (A+) Fine Condition
- Ref: 27101
Description:
This original very large lithograph map, a sea chart, with depth soundings, of The Central Pacific, centering on the Hawaiian Islands was complied by the Maritime Safety Agency Japan (MSAJ) from American & British charts. The maps centers on the Hawaiian Islands east to California and south to the Christmas Islands.
The importance of this map cannot be overstated in the context of time and would have no doubt been used by the Japanese carrier group and their attack on Pearl Harbour in 1941.
General Definitions:
Paper thickness and quality: - Heavy and stable
Paper color : - off white
Age of map color: - Original
Colors used: - Blue
General color appearance: - Authentic
Paper size: - 43in x 30in (1.090m x 760mm)
Plate size: - 43in x 30in (1.090m x 760mm)
Margins: - Min 1in (25mm)
Imperfections:
Margins: - None
Plate area: - None
Verso: - None
Background:
The attack on Pearl Harbor was a surprise military strike by the Imperial Japanese Navy Air Service upon the United States against the U.S. naval base at Pearl Harbor in Honolulu, Hawaii, just before 8:00 a.m. (local time) on Sunday, December 7, 1941. The United States was a neutral country at the time; the attack led to its formal entry into World War II on the side of the Allies the next day. The Japanese military leadership referred to the attack as the Hawaii Operation and Operation AI, and as Operation Z during its planning.
The attack was preceded by months of negotiations between the U.S. and Japan over the future of the Pacific. Japanese demands included that the U.S. end its sanctions against Japan, cease aiding China in the Second Sino-Japanese war, and allow Japan to access the resources of the Dutch East Indies. Anticipating a negative response from the US, Japan sent out its naval attack groups in November 1941 just prior to receiving the Hull note—the U.S. demand that Japan withdraw from China and French Indochina.
Japan intended the attack as a preventive action. Its aim was to prevent the United States Pacific Fleet from interfering with its planned military actions in Southeast Asia against overseas territories of the United Kingdom, the Netherlands, and those of the United States. Over the course of seven hours there were coordinated Japanese attacks on the U.S.-held Philippines, Guam, and Wake Island and on the British Empire in Malaya, Singapore, and Hong Kong.
The attack commenced at 7:48 a.m. Hawaiian Time (6:18 p.m. GMT). The base was attacked by 353 Imperial Japanese aircraft (including fighters, level and dive bombers, and torpedo bombers) in two waves, launched from six aircraft carriers. Of the eight U.S. Navy battleships present, all were damaged, with four sunk. All but USS Arizona were later raised, and six were returned to service and went on to fight in the war. The Japanese also sank or damaged three cruisers, three destroyers, an anti-aircraft training ship, and one minelayer. More than 180 US aircraft were destroyed. A total of 2,403 Americans were killed and 1,178 others were wounded, making it the deadliest event ever recorded in Hawaii. Important base installations such as the power station, dry dock, shipyard, maintenance, and fuel and torpedo storage facilities, as well as the submarine piers and headquarters building (also home of the intelligence section) were not attacked. Japanese losses were light: 29 aircraft and five midget submarines lost, and 64 servicemen killed. Kazuo Sakamaki, the commanding officer of one of the submarines, was captured.
Japan announced declarations of war on the United States and the British Empire later that day (December 8 in Tokyo), but the declarations were not delivered until the following day. The British government declared war on Japan immediately after learning that their territory had also been attacked, while the following day (December 8) the United States Congress declared war on Japan. On December 11, though they had no formal obligation to do so under the Tripartite Pact with Japan, Germany and Italy each declared war on the U.S., which responded with a declaration of war against Germany and Italy. There were numerous historical precedents for the unannounced military action by Japan, but the lack of any formal warning (required by part III of the Hague Convention of 1907), particularly while negotiations were still apparently ongoing, led President Franklin D. Roosevelt to proclaim December 7, 1941, a date which will live in infamy. Because the attack happened without a declaration of war and without explicit warning, the attack on Pearl Harbor was later judged in the Tokyo Trials to be a war crime.
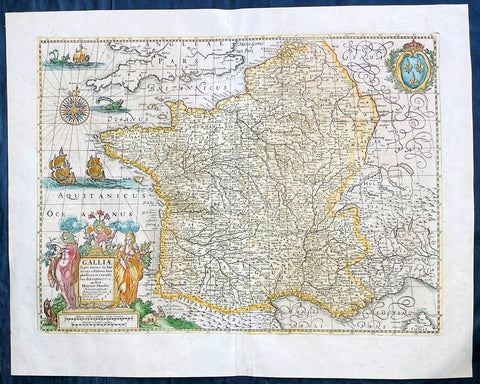
1639 Henricus Hondius Antique Map of France
Antique Map
- Title : Galliae supera omnes in hac...auctore Henrico Hondio
- Date : 1639
- Size: 22 1/2in x 18in (570mm x 455mm)
- Condition: (A+) Fine Condition
- Ref: 17039
Description:
This original hand coloured copper plate engraved antique map of France was published by Henricus Hondius & Jan Jansson in the 1639 French edition of Gerard Mercators Atlas.
General Definitions:
Paper thickness and quality: - Heavy and stable
Paper color : - off white
Age of map color: - Original
Colors used: - Pink, blue, green, yellow
General color appearance: - Authentic
Paper size: - 22 1/2in x 18in (570mm x 455mm)
Plate size: - 19 1/2in x 14 1/2in (500mm x 375mm)
Margins: - Min 1in (25mm)
Imperfections:
Margins: - None
Plate area: - None
Verso: - None
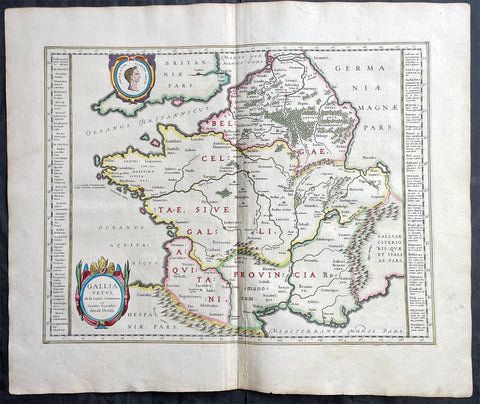
1638 Joan Blaeu & Abraham Ortelius Antique Map of France
Antique Map
- Title : Gallia Vetus...Abrah Ortelii
- Date : 1638
- Size: 23in x 20in (585mm x 510mm)
- Condition: (A+) Fine Condition
- Ref: 70606
Description:
This original beautifully hand coloured copper-plate engraved antique map of France, after Abraham Ortelius, was published by Joan Blaeu in the 1638 French edition of Atlas Nouvs,.
General Definitions:
Paper thickness and quality: - Heavy and stable
Paper color : - off white
Age of map color: - Original
Colors used: - Pink, blue, green, yellow
General color appearance: - Authentic
Paper size: - 23in x 20in (585mm x 510mm)
Plate size: - 19 1/2in x 15in (500mm x 380mm)
Margins: - Min 1in (25mm)
Imperfections:
Margins: - None
Plate area: - None
Verso: - None
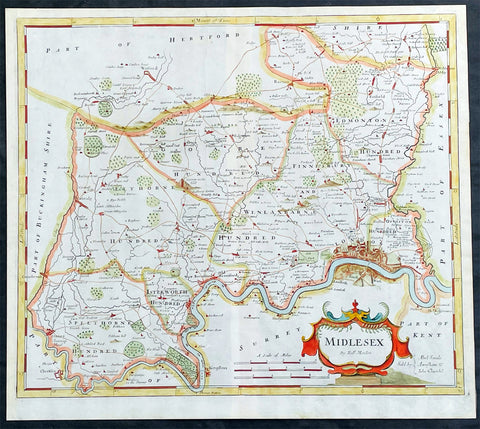
1722 Robert Morden Antique Map of The English County of Middlesex, London
Antique Map
- Title : Midlesex
- Date : 1722
- Size: 17 1/2in x 15 1/2in (445mm x 395mm)
- Condition: (A+) Fine Condition
- Ref: 35603
Description:
This original hand coloured copper-plate engraved antique map of the county of Middlesex and London by Robert Morden was published in the 1722 edition of Camdens Britannia.
General Definitions:
Paper thickness and quality: - Heavy and stable
Paper color : - off white
Age of map color: - Original
Colors used: - Pink, blue, green, yellow
General color appearance: - Authentic
Paper size: - 17 1/2in x 15 1/2in (445mm x 395mm)
Plate size: - 17 1/2in x 15 1/2in (445mm x 395mm)
Margins: - Min 1/2in (12mm)
Imperfections:
Margins: - None
Plate area: - None
Verso: - None
Background:
These maps are the first county maps to show roads (based on Ogilby’s road maps) and show three scales representing great, middle and small miles as different scales were used in different parts of the country. Morden was employed to replace the outdated maps by Saxton, engraved by Kip and Hole. He based his maps on manuscript sources plus the surveys of Ogilby and Morgan, Seller, Palmer and the coastal charts of Captain Grenville Collins. One innovation was the showing of longitudes measured from the meridian of St. Paul's Cathedral given in the form of time in minutes at the top of the map in Roman numerals and at the bottom in degrees. This was done to clarify local times that were taken from the sun as there was no national standard time. Gibson said:' Where actual Surveys could be had, they were purchased at any rate; and for the rest, one of the best Copies extanct was sent to some of the most knowing Gentlemen in each County; with a request to supply the defects, rectified the positions, and correct the false spellings. And that nothing might be wanting to render them as complete and accurate as might be, this whole business was commited to Mr Robert Morden, a person of know abilities in these matters'..from the Preface of the Britannia.

1879 Lorenz Large Antique Map Coal Seams Schuylkill County, Pennsylvania Reading
Antique Map
- Title : Map Showing Coal Laterals of the Philadelphia & Reading Rail Raod company William Lorenz Chief Eng. 1879
- Date : 1879
- Size: 29in x 19 1/2in (735mm x 495mm)
- Condition: (A) Very Good Condition
- Ref: 93520
Description:
This original, large folding rare lithograph map of the Coal Fields of Schuylkill County, Pennsylvania, owned at the time by the Pennsylvania & Reading Railroad Company by William Lorenz was engraved and published in 1879 - dated.
The Definition of a Coalseam lateral is any system of development in coal seams or thick orebodies in which headings are driven horizontally across the coal or ore and connected to main haulage drifts, entries, or shafts. There are many variations and modifications depending on the thickness, shape, and inclination of the deposit.(Ref Tooley M&B)
General Definitions:
Paper thickness and quality: - Heavy and stable
Paper color : - off white
Age of map color: - Original
Colors used: - Pink, blue
General color appearance: - Authentic
Paper size: - 29in x 19 1/2in (735mm x 495mm)
Plate size: - 29in x 19 1/2in (735mm x 495mm)
Margins: - Min 1/2in (12mm)
Imperfections:
Margins: - Chipping to map edges not affecting the image
Plate area: - Light wear along sectioned edges
Verso: - Backed in linen
Background:
Schuylkill is a county in the Commonwealth of Pennsylvania. It is located in the heart of Pennsylvanias Coal Region and is part of Northeastern Pennsylvania. As of the 2020 census, the population was 143,049. The county seat is Pottsville.
The county was created on March 1, 1811, from parts of Berks and Northampton counties and named for the Schuylkill River, which originates in the county. On March 3, 1818, additional territory in its northeast was added from Columbia and Luzerne counties. The county is part of the Pottsville, Pennsylvania Micropolitan Statistical Area.
The lands that today constitute Schuylkill County were acquired by William Penns proprietors by treaty executed August 22, 1749, with representatives of the Six Nations and the Delaware, Shamokin and Shawnee, who received 500 pounds lawful money of Pennsylvania. The territory described included all of Schuylkill County except the northern part of Union Township, which was included in the purchase of 1768.
In the year 1754, the area that would become Schuylkill County along with the areas that today are Berks, Dauphin, Lebanon, and Lehigh counties were settled by German immigrants. The earliest settlers in southeastern Schuylkill County, which was then part of Northampton County, were primarily Moravian missionaries from Saxony. Other early settlers in southern Schuylkill County were German Palatines.
An early mill in the county was built in 1744 by John Finscher, but it later burned down. The first log church in the county was built in 1755. Native American massacres were commonplace in Schuylkill County between 1755 and 1765. Warrant for tracts of land in the vicinity of McKeansburg were in existence as early as 1750. Found by Sammy Hepler in 1789.
Anthracite coal (then called stone coal) was discovered by Necho Allen near the area where Pottsville was ultimately developed in 1790. In 1795, a blacksmith in Schuylkill County named Whetstone learned how to use the coal successfully for smithing purposes. In 1806 coal was found while the tail-race was cut of the Valley (Iron) Forge, on the Schuylkill. Daniel Berlin, another blacksmith, also used it successfully, and smiths in the neighborhood adopted using the coal.
Schuylkill County was created via an Act of Assembly on March 1, 1811, from portions of Berks and Northampton counties. More land was added to the county in 1818, from Columbia and Luzerne counties. At the time of its creation, the county had a population of about 6,000. An early book of Schuylkill County history was written by Daniel Deibert in 1802.
Orwisgsburg was the first community in Schuylkill County to be laid out. During the early years of Schuylkill County, there was an attempt to make McKeansburg the county seat; Orwigsburg was also a contender. Orwigsburg was agreed upon to be the county seat, as it was deemed to be well-suited for industries. Beginning in 1831, sentiment began to rise for moving the county seat to Pottsville. In 1846, the Legislature passed an Act that was approved by Governor Francis R. Shunk on March 13, submitting the question to the voters. The change was desired principally because the railroad and canal connections with Orwigsburg were problematic to transport the public to that town without losing valuable time while Pottsville had such facilities and was within easy access from all parts of the county.
In 1812, George Shoemaker who, with Necho Allen, had discovered stone coal at Centerville in Schuylkill County, personally delivered some coal to Philadelphia. He gave away most of the coal, intending to encourage individuals to find ways to use it. Most of the experiments failed and though Shoemaker was nearly run out of town and called an imposter, Mellon and Bishop of Delaware County successfully used it in their rolling mill. When other rolling mills also adopted the fuel, a large industrial market and demand developed.
The Schuylkill Navigation Company was chartered in 1815 to build a series of navigation improvements in the Schuylkill River. This was during a period when the much larger Erie Canal along the Mohawk River in New York also was being developed. It was well ahead of other key canals fueling the Industrial Revolution, such as the Delaware and Hudson, the Lehigh, the Chesapeake and Ohio, Delaware and Raritan, and Morris canals. The originators of the project did not count upon the coal trade to promote the success of the undertaking. They looked forward mainly to transporting the agricultural products being produced below the mountains, the lumber of Schuylkill County, and the grain and other products of the counties between the Susquehanna and Schuylkill rivers. The first shipments of coal by canal were made in 1822 when 1,480 tons were sent down the line.
With a regular supply of anthracite coal ensured, the southern anthracite coal field in Schuylkill County attracted speculators and fortune hunters. They were inspired by dreams of becoming millionaires. This was the first speculative era of the Schuylkill coal trade. Pottsville became the center of the movement. The more successful explorers revealed numerous veins of coal, extending over a vast stretch of county and with a seemingly inexhaustible quantity of coal. These discoveries brought excitement and speculation; lands were bought (and sold); roads were laid out in the forest, mines were opened and railroads projected, and innumerable town plots planned. The demand for houses was so great that the lumber for many was framed in Philadelphia and sent by canal to the burgeoning coal region.
At this stage, coal-mining firms were small and family owned. The residents and entrepreneurs of the Schuylkill region opposed the entry here of incorporated coal companies. In these years, coal mining operations in the Schuylkill region were conducted with economy, and relatively little capital was required. As the workings were all above the water level, no machinery was required for water drainage or for hoisting coal to the surface. Coal breakers and other expensive fixtures and appliances for the preparation of coal had not then been introduced. Numerous operators produced from five to six thousand tons for market annually (which was then considered a respectable business), who had never committed thousands of dollars to their enterprises, including their first land purchases of coal mines. It was commonly asserted that coal land could be bought and mines opened for less capital than the purchase and stocking of a decent farm. Such mines could be worked for less capital than that required to establish a line of stagecoaches or transportation wagons.
Eventually, railroads replaced the canals as the primary means of transporting coal to markets. Mining was taken over by major corporate business, especially after the Civil War. As a result, the Middle Coal Field was developed in the 1860s and the Philadelphia and Reading Railroad created a subsidiary (Philadelphia and Reading Coal and Iron Company) to buy or lease, and develop the expanding industrial coal trade. Consumption of coal along the Schuylkill above Philadelphia in 1839 was 30,290 tons when the Pioneer at Pottsville, the first anthracite furnace in the United States, became operational. By 1849, consumption had increased to 239,290 tons, to 554,774 tons in 1859, and to 1,787,205 tons in 1873.
The numerous jobs in the mining industry comprised a catalyst for mass immigration to Schuylkill County from the British Isles and Europe in the 19th and 20th centuries. As mines became more numerous (by 1846 there were 110 operators in the region and 142 collieries in Schuylkill County) and more complex (in 1846 there were 35 collieries below water level), mechanical breakers, steam locomotive, it became more labor-intensive both for accomplishing mining tasks and supporting minings peripheral industries. Such industries included manufacturing of explosives, metal screens, pump components, piping, and timber for support. This led to an influx of population into Schuylkill and other anthracite counties to fill these jobs. Beginning with the Irish immigration in the 1840s (fueled by the Great Famine), after the Civil War, beginning in the 1870s, newcomers arrived from Eastern Europe. Poles, Hungarians, Lithuanians, Slovaks, Rusyns and Ukrainians (Ruthenians), often from the Austro-Hungarian monarchy settled in the villages of Schuylkill County and took their place among the laborers in the coal mines. By the 1880s and 1890s, thousands of Italians immigrated for jobs related to mining.
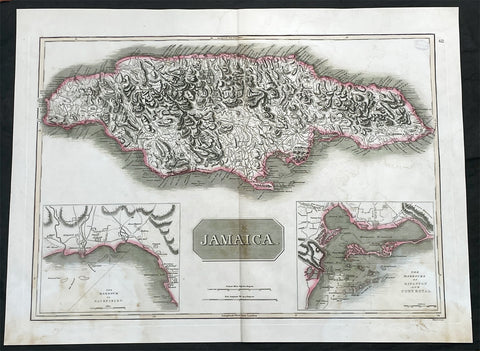
1817 John Thompson Large Antique Map of the Caribbean Island of Jamaica
Antique Map
- Title : Jamaica
- Date : 1817
- Size: 27in x 21in (685mm x 535mm)
- Condition: (A) Very Good Condition
- Ref: 35605
Description:
This large original, beautifully hand coloured copper plate engraved antique map of the Caribbean Islands was published by John Thomson in his large elephant folio 1817 edition of A New General Atlas of the World. (Ref Tooley M&B)
General Definitions:
Paper thickness and quality: - Heavy and stable
Paper color : - off white
Age of map color: - Original
Colors used: - Yellow, green, blue, pink
General color appearance: - Authentic
Paper size: - 27in x 21in (685mm x 535mm)
Plate size: - 27in x 21in (685mm x 535mm)
Margins: - Min 1/2in (12mm)
Imperfections:
Margins: - Light age toning
Plate area: - Light age toning, small library stamp to right
Verso: - Age toning
1817 John Thompson Large Antique Map Caribbean Islands of St Vincent & Barbados
Antique Map
- Title : West India Islands: St Vincent; Barbados
- Date : 1817
- Size: 27in x 21in (685mm x 535mm)
- Condition: (A) Very Good Condition
- Ref: 35610
Description:
This large original, beautifully hand coloured copper plate engraved antique map of the Caribbean Islands was published by John Thomson in his large elephant folio 1817 edition of A New General Atlas of the World. (Ref Tooley M&B)
General Definitions:
Paper thickness and quality: - Heavy and stable
Paper color : - off white
Age of map color: - Original
Colors used: - Yellow, green, blue, pink
General color appearance: - Authentic
Paper size: - 27in x 21in (685mm x 535mm)
Plate size: - 27in x 21in (685mm x 535mm)
Margins: - Min 1/2in (12mm)
Imperfections:
Margins: - Bottom L&R margins extended from borders, not affecting the image
Plate area: - Light age toning, small library stamp to right
Verso: - Age toning
1817 John Thompson Large Antique Map Caribbean Is. St Christopher St Lucia Nevis
Antique Map
- Title : West India Islands: St Christopher; St Lucia; Nevis
- Date : 1817
- Size: 27in x 21in (685mm x 535mm)
- Condition: (A) Very Good Condition
- Ref: 35609
Description:
This large original, beautifully hand coloured copper plate engraved antique map of the Caribbean Islands was published by John Thomson in his large elephant folio 1817 edition of A New General Atlas of the World. (Ref Tooley M&B)
General Definitions:
Paper thickness and quality: - Heavy and stable
Paper color : - off white
Age of map color: - Original
Colors used: - Yellow, green, blue, pink
General color appearance: - Authentic
Paper size: - 27in x 21in (685mm x 535mm)
Plate size: - 27in x 21in (685mm x 535mm)
Margins: - Min 1/2in (12mm)
Imperfections:
Margins: - Bottom L&R margins extended from borders, not affecting the image
Plate area: - Light age toning, small library stamp to right
Verso: - Age toning
1817 John Thompson Large Antique Map Caribbean Islands of Martinique & Dominica
Antique Map
- Title : West India Islands: Martinico (Cul de Sac Royal); Dominica
- Date : 1817
- Size: 27in x 21in (685mm x 535mm)
- Condition: (A) Very Good Condition
- Ref: 35606
Description:
This large original, beautifully hand coloured copper plate engraved antique map of the Caribbean Islands of Martinique and Dominica was published by John Thomson in his large elephant folio 1817 edition of A New General Atlas of the World. (Ref Tooley M&B)
General Definitions:
Paper thickness and quality: - Heavy and stable
Paper color : - off white
Age of map color: - Original
Colors used: - Yellow, green, blue, pink
General color appearance: - Authentic
Paper size: - 27in x 21in (685mm x 535mm)
Plate size: - 27in x 21in (685mm x 535mm)
Margins: - Min 1/2in (12mm)
Imperfections:
Margins: - Bottom L&R margins extended from borders, not affecting the image
Plate area: - Light age toning
Verso: - Age toning
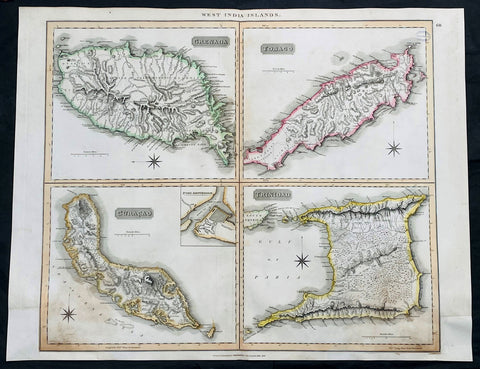
1816 John Thompson Large Antique Map Grenada, Tobago, Curacao Trinidad Caribbean
Antique Map
- Title : West India Islands: Grenada; Tobago; Curacao; Trinadad.
- Date : 1816
- Size: 27in x 21in (685mm x 535mm)
- Condition: (A) Very Good Condition
- Ref: 35612
Description:
This large original, beautifully hand coloured copper plate engraved antique map of the Caribbean Islands Grenada, Tobago, Curacao & Trinidad was published by John Thomson in his large elephant folio 1817 edition of A New General Atlas of the World. (Ref Tooley M&B)
General Definitions:
Paper thickness and quality: - Heavy and stable
Paper color : - off white
Age of map color: - Original
Colors used: - Yellow, green, blue, pink
General color appearance: - Authentic
Paper size: - 27in x 21in (685mm x 535mm)
Plate size: - 27in x 21in (685mm x 535mm)
Margins: - Min 1/2in (12mm)
Imperfections:
Margins: - Bottom L&R margins extended from borders, not affecting the image
Plate area: - Light age toning, small library stamp to right
Verso: - Age toning
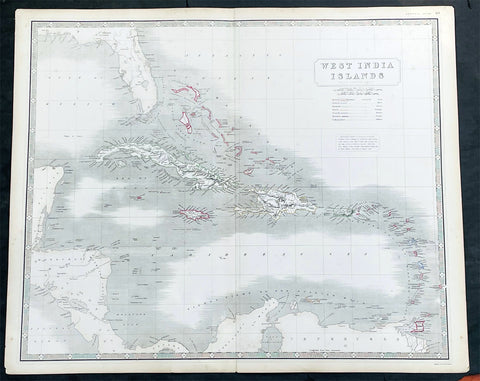
1845 Johnston Large Antique Map Florida, Caribbean, Cuba, Haiti, Central America
Antique Map
- Title : West India Islands
- Date : 1845
- Size: 25in x 21in (635mm x 535mm)
- Condition: (A+) Fine Condition
- Ref: 35619
Description:
This large original hand coloured steel plate engraved antique map of West Indian, Caribbean Islands, was published by W & AK Johnston in his General Atlas, 1845.
General Definitions:
Paper thickness and quality: - Heavy and stable
Paper color : - off white
Age of map color: - Original
Colors used: - Yellow, green, blue, pink
General color appearance: - Authentic
Paper size: - 25in x 21in (635mm x 535mm)
Plate size: - 25in x 21in (635mm x 535mm)
Margins: - Min 1/2in (12mm)
Imperfections:
Margins: - None
Plate area: - None
Verso: - None
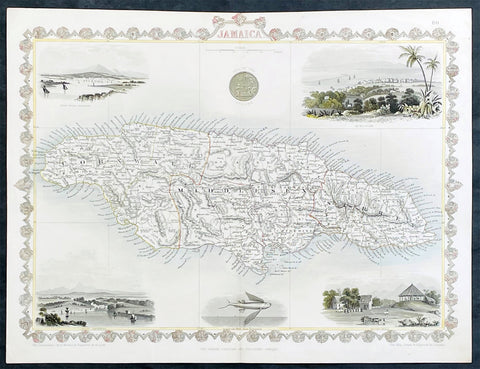
1851 John Tallis Antique map of the Island of Jamaica
Antique Map
- Title : Jamaica
- Date : 1851
- Size: 15in x 11in (380mm x 280mm)
- Condition: (A+) Fine Condition
- Ref: 35616
Description:
This original hand coloured copper plate engraved antique map of Jamaica, with decorative vignettes of Kingston, Port Antonio, Port Royal, a sugar mill and a flying fish, was published by John Tallis in 1851.
General Definitions:
Paper thickness and quality: - Heavy and stable
Paper color : - off white
Age of map color: - Original
Colors used: - Yellow, green, blue, pink
General color appearance: - Authentic
Paper size: - 15in x 11in (380mm x 280mm)
Plate size: - 15in x 10in (380mm x 255mm)
Margins: - Min 1/2in (12mm)
Imperfections:
Margins: - None
Plate area: - Light crease left side of image
Verso: - None
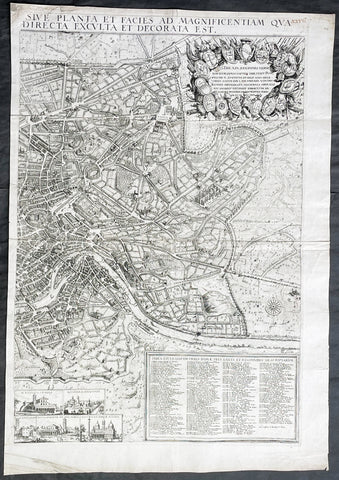
1679 Jacob von Sandrart & Giovanni Battista Falda Large Left Hand Sheet of Rome
Antique Map
- Title : Recentis Romae Ichnographia et Hypsographia Sive Planta et Faies Ad Magnificentiam Qua Prioribus Annis Urbs Ipsa Directa Exculta et Decorata Est.
- Date : 1679
- Size: 26 3/4in x 18 3/4in (680mm x 475mm)
- Condition: (A+) Fine Condition
- Ref: 43188
Description:
This large, original copper plate engraved scarce left hand section of the map of Rome by Jacob Von Sandrart, after Giovanni Battista Falda map, was published in 1679.
This map is based on Giovanni Battista Falda's 12-sheet view of Rome, Nuova Pianta et alzata della citta di Roma, first published in 1676.
Sandrart's view of Rome is rare, we are aware of only 2 examples appearing at auction during the last 25 years.
General Definitions:
Paper thickness and quality: - Heavy and stable
Paper color : - off white
Age of map color: -
Colors used: -
General color appearance: -
Paper size: - 26 3/4in x 18 3/4in (680mm x 475mm)
Plate size: - 25in x 17in (635mm x 430mm)
Margins: - Min 1/2in (12mm)
Imperfections:
Margins: - None
Plate area: - Light creasing along centerfold
Verso: - None
Background:
Jacob von Sandrart's rare and exquisitely engraved view of Rome, one of the finest impressions of the 'Eternal City' made during the great Baroque Era of Art and Architecture.
This finely engraved and lavishly decorative view of Rome takes in all of the 'Eternal City', as it was encompassed by its ancient Aurelian Walls, built during the 2nd Century A.D., on the banks of the River Tiber. Numerous monuments and sites, all of which are still present today, can be seem on the view, including the Coliseum, the Pantheon, the Piazza del Popolo, the Church of San Giovanni Laterno, the Baths of Diocletian, and the Vatican, which is dominated by the Dome of St. Peter's Basilica and the Castel Sant'Angelo. Most notable is the great oval Colonnade that lines the square in front of St. Peter's, which had only been completed in 1666 by the Gianlorenzo Bernini, one of the towering figures of the Baroque Era. The quality of the engraving is exceptionally high, as is the composition of the view, which grants the observer a panoptic view over Rome, while the specific details of the cityscape remain sharply distinguishable.
In the upper left, the title cartouche is surmounted by a portrait of Pope Innocent XI (reigned 1676-89), considered to be a leader of great learning and political acumen. In the upper right corner is a montage featuring the shields of the 14 traditional districts (wards) of Rome. Flowing through the view itself, the River Tiber has its orgins in an allegorical personification of its springs.
In the lower left, a table, 'Index Aedium Antiquitatarum' identifies an amazing 253 ancient buildings and ruins throughout the city. The 'Index Ecclesiarium' in the lower right identifies an incredible 178 churches, although it is not surprising that Rome had by far more houses of worship than any other city in Europe.
In the lower center of the plan are seven views of some of the city's most prominent churches, including St. Peter's Basilica (Vatican), St. Paul's Basilica, San Sebastian Church, San Giovanni Laterno, Sacred Cross of Jerusalem Church, Basilica of St. Lawrence Outside the Walls and the Basilica of Santa Maria Maggiore.
At the time that this view was issued, Rome was enjoying a period of prosperity, and the city's population had reached over 120,000, making it one of the 10 largest cities in Europe. The Roman Catholic Church was on a high, having largely succeeded in driving the Counterreformation, and revenues were pouring in to the Vatican from around the world. This funded the great flourishing of art and architecture in Baroque Rome.
The map was engraved by Jacob von Sandrart (1630-1708), one of the leading fine art engravers of the 17th Century. Born in Frankfurt-am-Main, he apprenticed under his famous uncle Joachim von Sandrart in Amsterdam. He worked in Danzing and Regensburg, and by 1656 had established himself in Nuremberg, where he remained for the rest of his life. Sandrart was highly productive, as over 400 different engravings from his burin are known to survive, although the high quality of his work never wavered. Along with his maps, he is especially well-known for his portraits. Sandrart was the founder and first director of the Nuremberg Academy of Fine Arts (chartered 1662).
Sandrart, Jacob von 1630 - 1708
Jacob von Sandrart was a German engraver primarily active in Nuremberg.
At age ten Sandrart obtained his artistic training from his better-known uncle Joachim von Sandrart in Amsterdam. After spending time in Danzig and Regensburg, he married Regina Christina Eimart, daughter of the engraver Georg Christoph Eimart the elder, on 10 June 1654. The couple settled in Nuremberg in 1656 and remained there for the rest of their lives. His daughter Susanne Maria von Sandrart was also an artist and engraver.
Sandrart was a very prolific artist; over 400 engravings from his hand are extant. He was best known as a portraitist of prominent contemporary citizens of Nuremberg, as an engraver of maps, and as an illustrator of the literary works of Nuremberg writers, especially Sigmund von Birken. Today Sandrart is best remembered as the founder and first director of the Nuremberg Academy of Fine Arts (est. 1662).
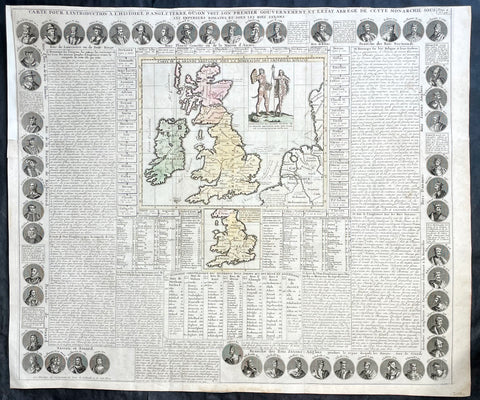
1719 Chatelain Antique Map Great Britain & Ireland Royalty Egbert to Queen Anne
Antique Map
- Title : Carte Pour L Introduction a L Historire S Angleteerre...
- Date : 1719
- Size: 25in x 21in (635mm x 535mm)
- Condition: (A+) Fine Condition
- Ref: 93426
Description:
This large beautifully hand coloured original antique map and illustration of Great Britain and Ireland, with text and pictorial representations of all the Kings and Queens from Egbert in 801 to Queen Anne in 1701, was published by Henri Abraham Chatelain in 1719, in his famous Atlas Historique.
General Definitions:
Paper thickness and quality: - Heavy and stable
Paper color : - off white
Age of map color: - Early
Colors used: - Yellow, pink, blue, green
General color appearance: - Authentic
Paper size: - 25in x 21in (635mm x 535mm)
Plate size: - 25in x 21in (635mm x 535mm)
Margins: - Min 1/4in (6mm)
Imperfections:
Margins: - Top left margin extended
Plate area: - None
Verso: - None
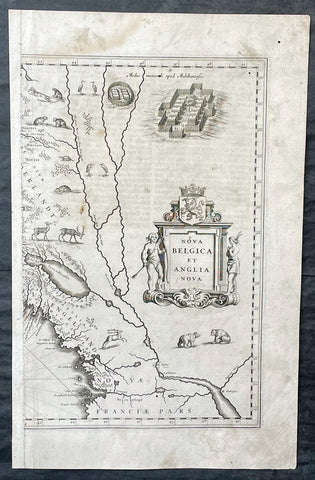
1635 Joan Blaeu Antique Half Page Map of New England, Nova Belgica et Anglia
Antique Map
- Title : Nova Belgica Et Anglia Nova
- Date : 1635
- Size: 18 1/2in x 12in (470mm x 305mm)
- Condition: (A) Good Condition
- Ref: 16385
Description:
This original copper-plate engraved antique half right hand page map of New England & NE America by Joan Blaeu was published in the 1635 German edition of Atlas Novus.
This is the right hand, cartouche title section of this important map.
General Definitions:
Paper thickness and quality: - Heavy and stable
Paper color : - off white
Age of map color: -
Colors used: -
General color appearance: -
Paper size: - 18 1/2in x 12in (470mm x 305mm)
Plate size: - 15 1/2in x 10in (395mm x 255mm)
Margins: - Min 1/2in (12mm)
Imperfections:
Margins: - Soiling, small worm hole top right margin
Plate area: - Light soiling, 4 small worm holes
Verso: - Light soiling
Background:
This important map was one of the most attractive of the Americas published at the time. It is noted for the fact that its primary source is the first manuscript figurative map of Adriaen Block from 1614. Indeed it is the first full representation of it in print. It is one of the earliest to name Nieu Amsterdam. Block, a Dutch fur trader, explored the area between Cape Cod and Manhattan, examining the bays and rivers along the way. This helped to create an accurate picture of the longitudinal scale of the coastline. His manuscript map is the first document to delineate an insular Manhattan; it also provides the earliest appearance of Manhates and Niev Nederland.
It has been noted that the time difference between 1614, the date of the manuscript, and Blaeus map whose first appearance is in 1635, appears long for such an important advance. It would seem highly feasible that Blaeu, who published many separately issued maps, would have wanted to produce one like this sooner. However, evidence points to the fact that it could not have been made before 1630. The Stokes Collection in New York possesses an example of the map on thicker paper without text on the reverse which could well be a proof issue of some kind.
There are features on Blaeus map that differ from the Block chart. Some of these could be accounted for by the fact that the surviving figurative map is not the original, and that the copyist omitted some place names that are referred to in the text of de Laets work. Block drew on Champlains map of 1612 for the depiction of the lake named after him, but it is here called Lacus Irocoisiensis. … The lack of interrelation between the Dutch or English colonies and the French, led for some time to the eastward displacement of this lake when its true position would be north of the Hudson River.
Some nomenclature has its origins in Blaeus second Paskaert of c.1630, and others, such as Manatthans, in de Laet. The colony of Nieu Pleimonth is identified. This and other English names along that part of the coast are largely derived from Smith\\\'s New England, 1616. Cape Cod is here improved over the Block manuscript by being reconnected to the mainland, the narrow strait having been removed. The coastline between here and Narragansett Bay, which can be clearly recognized, is not so accurate. Adriaen Blocx Eylandt leads us to the Versche Rivier, or Connecticut River, which Block ascended as far as was possible. t Lange Eyland is named; however, it is incorrectly too far east, being applied to what is possibly Fishers Island. De Groote bay marks Long Island Sound. The Hudson River is still not named as such, but is littered with Dutch settlements, and the failed Fort Nassau is here depicted renamed as Fort Orange. He does, however, improve on the direction of its flow. Blaeu separates the sources of the Hudson and Delaware Rivers which had been causing some confusion. Nieu Amsterdam is correctly marked as a fort at the tip of an island separated on the east side by Hellegat, or the East River. The coastline south of Sandy Hook also shows signs of improvement.
The whole map is adorned by deer, foxes, bears, egrets, rabbits, cranes and turkeys. Beavers, polecats and otters appear on a printed map for the first time. The Mohawk Indian village top right is derived from the de Bry-White engravings.

1855 John Bartholomew Large Antique Goldfields Map of Victoria, Australia
Antique Map
- Title : Victoria The Gold Districts are coloured (sic yellow)
- Date : 1855
- Size: 17 1/2in x 12 1/2in (445mm x 320mm)
- Condition: (A+) Fine Condition
- Ref: 27096
Description:
This large hand coloured & scarce antique lithograph Goldfields Map of Victoria, Australia (with an inset map of the Mt Alexander & Castlemaine regions) by John Bartholomew was published in the 1855 edition of A & C Blacks General Atlas of The World
General Definitions:
Paper thickness and quality: - Heavy and stable
Paper color : - off white
Age of map color: - Original
Colors used: - Green, yellow, pink
General color appearance: - Authentic
Paper size: - 17 1/2in x 12 1/2in (445mm x 320mm)
Plate size: - 17 1/2in x 12 1/2in (445mm x 320mm)
Margins: - Min 1/2in (12mm)
Imperfections:
Margins: - None
Plate area: - None
Verso: - None
Background:
The first gold rush in Australia began in May 1851 after prospector Edward Hargraves claimed to have discovered payable gold near Orange, at a site he called Ophir. Hargraves had been to the Californian goldfields and had learned new gold prospecting techniques such as panning and cradling. Hargraves was offered rewards by the Colony of New South Wales and the Colony of Victoria. Before the end of the year, the gold rush had spread to many other parts of the state where gold had been found, not just to the west, but also to the south and north of Sydney.
The Australian gold rushes changed the convict colonies into more progressive cities with the influx of free immigrants. These hopefuls, termed diggers, brought new skills and professions, contributing to a burgeoning economy. The mateship that evolved between these diggers and their collective resistance to authority led to the emergence of a unique national identity. Although not all diggers found riches on the goldfields, many decided to stay and integrate into these communities.
In July 1851, Victoria\'s first gold rush began on the Clunes goldfield. In August, the gold rush had spread to include the goldfield at Buninyong (today a suburb of Ballarat) 45 km (28 m) away and, by early September 1851, to the nearby goldfield at Ballarat (then also known as Yuille\'s Diggings) followed in early September to the goldfield at Castlemaine (then known as Forest Creek and the Mount Alexander Goldfield) and the goldfield at Bendigo (then known as Bendigo Creek) in November 1851. Gold, just as in New South Wales, was also found in many other parts of the state. The Victorian Gold Discovery Committee wrote in 1854:
The discovery of the Victorian Goldfields has converted a remote dependency into a country of world wide fame; it has attracted a population, extraordinary in number, with unprecedented rapidity; it has enhanced the value of property to an enormous extent; it has made this the richest country in the world; and, in less than three years, it has done for this colony the work of an age, and made its impulses felt in the most distant regions of the earth.
When the rush began at Ballarat, diggers discovered it was a prosperous goldfield. Lieutenant-Governor, Charles La Trobe visited the site and watched five men uncover 136 ounces of gold in one day. Mount Alexander was even richer than Ballarat. With gold sitting just under the surface, the shallowness allowed diggers to easily unearth gold nuggets. In 7 months, 2.4 million pounds of gold was transported from Mount Alexander to nearby capital cities.
The gold rushes caused a huge influx of people from overseas. Australia\'s total population more than tripled from 430,000 in 1851 to 1.7 million in 1871. Australia first became a multicultural society during the gold rush period. Between 1852 and 1860, 290,000 people migrated to Victoria from the British Isles, 15,000 came from other European countries, and 18,000 emigrated from the United States. Non-European immigrants, however, were unwelcome, especially the Chinese.
The Chinese were particularly industrious, with techniques that differed widely from the Europeans. This and their physical appearance and fear of the unknown led to them to being persecuted in a racist way that would be regarded as untenable today.
In 1855, 11,493 Chinese arrived in Melbourne. Chinese travelling outside of New South Wales had to obtain special re-entry certificates. In 1855, Victoria enacted the Chinese Immigration Act 1855, severely limiting the number of Chinese passengers permitted on an arriving vessel. To evade the new law, many Chinese were landed in the south-east of South Australia and travelled more than 400 km across country to the Victorian goldfields, along tracks which are still evident today.
In 1885, following a call by the Western Australian government for a reward for the first find of payable gold, a discovery was made at Halls Creek, sparking a gold rush in that state.