Maps (84)
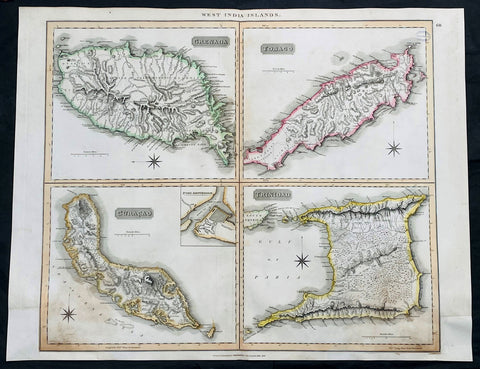
1816 John Thompson Large Antique Map Grenada, Tobago, Curacao Trinidad Caribbean
Antique Map
- Title : West India Islands: Grenada; Tobago; Curacao; Trinadad.
- Date : 1816
- Size: 27in x 21in (685mm x 535mm)
- Condition: (A) Very Good Condition
- Ref: 35612
Description:
This large original, beautifully hand coloured copper plate engraved antique map of the Caribbean Islands Grenada, Tobago, Curacao & Trinidad was published by John Thomson in his large elephant folio 1817 edition of A New General Atlas of the World. (Ref Tooley M&B)
General Definitions:
Paper thickness and quality: - Heavy and stable
Paper color : - off white
Age of map color: - Original
Colors used: - Yellow, green, blue, pink
General color appearance: - Authentic
Paper size: - 27in x 21in (685mm x 535mm)
Plate size: - 27in x 21in (685mm x 535mm)
Margins: - Min 1/2in (12mm)
Imperfections:
Margins: - Bottom L&R margins extended from borders, not affecting the image
Plate area: - Light age toning, small library stamp to right
Verso: - Age toning
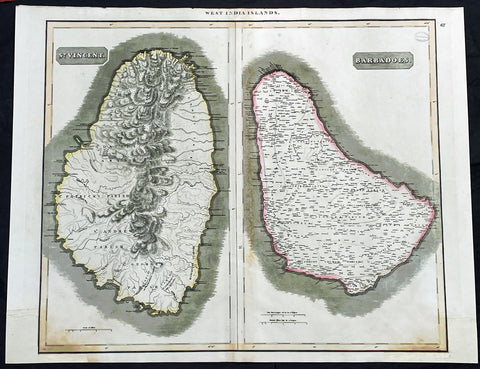
1817 John Thompson Large Antique Map Caribbean Islands of St Vincent & Barbados
Antique Map
- Title : West India Islands: St Vincent; Barbados
- Date : 1817
- Size: 27in x 21in (685mm x 535mm)
- Condition: (A) Very Good Condition
- Ref: 35610
Description:
This large original, beautifully hand coloured copper plate engraved antique map of the Caribbean Islands was published by John Thomson in his large elephant folio 1817 edition of A New General Atlas of the World. (Ref Tooley M&B)
General Definitions:
Paper thickness and quality: - Heavy and stable
Paper color : - off white
Age of map color: - Original
Colors used: - Yellow, green, blue, pink
General color appearance: - Authentic
Paper size: - 27in x 21in (685mm x 535mm)
Plate size: - 27in x 21in (685mm x 535mm)
Margins: - Min 1/2in (12mm)
Imperfections:
Margins: - Bottom L&R margins extended from borders, not affecting the image
Plate area: - Light age toning, small library stamp to right
Verso: - Age toning
1855 A D Bache Rare Antique Map Santa Barbara &San Pedro, Los Angeles California
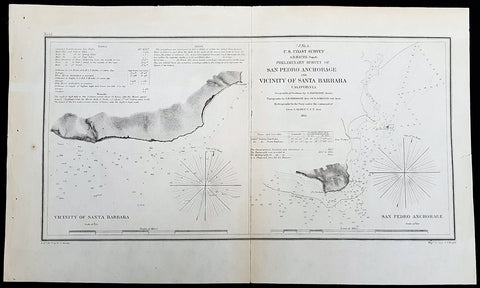
- Title : US Coast Survey A D Bache Super. Prelimanary Survey of San Pedro Anchorage and Vicinty of Santa Barbara California....1855
- Size: 16 1/2in x 10n (405mm x 255mm)
- Condition: (A+) Fine Condition
- Date : 1855
- Ref #: 93010
Description:
This rare, original antique lithograph early maps of Santa Barbara and San Pedro (Los Angeles), California, by Alexander Dallas Bache (great-grandson of Benjamin Franklin) in 1856 - dated - was published by the official chart-maker of the United States, the office of The US Coast Survey.
The Office of the Coast Survey, founded in 1807 by President Thomas Jefferson and Secretary of Commerce Albert Gallatin, is the oldest scientific organization in the U.S. Federal Government. Jefferson created the Survey of the Coast, as it was then called, in response to a need for accurate navigational charts of the new nation\'s coasts and harbors.
General Definitions:
Paper thickness and quality: - Heavy and stable
Paper color : - off white
Age of map color: -
Colors used: -
General color appearance: -
Paper size: - 16 1/2in x 10n (405mm x 255mm)
Plate size: - 16 1/2in x 10n (405mm x 255mm)
Margins: - Min 1/2in (12mm)
Imperfections:
Margins: - None
Plate area: - Folds as issued
Verso: - Some folds re-enforced with archival tape
Background:
An uncommon example of the 1855 U.S. Coast Survey nautical chart or maritime map of Santa Barbara and San Pedro (Los Angeles), California. Essentially two maps on a single sheet, the left hand map details the stretch of land that would evolve into the city of Santa Barbara. When the Coast Survey issued this map Santa Barbara was, for all intent and purposes, uninhabited. The right hand map focuses on Point Fermin and the San Pedro Anchorage. When this map was issued the mission and landing at San Pedro had been established, as had the Los Angeles Mission further north. Today the modern city of Los Angeles incorporates this entire area. As a nautical map it further includes countless depth soundings (in feet) and a wealth of practical information for the mariner. The triangulation for this map was completed by G. Davidson. The topography is the word of A. M. Harrison and W. M Johnson. The hydrography was accomplished by a team under the command of J. Alden. The whole was compiled under the direction of A. D. Bache, one of the U.S. Coast Survey\'s most influential and prolific superintendents, for issue in the 1855 annual report to Congress.
U.S. Coast Survey (Office of Coast Survey)
The Office of Coast Survey is the official chart-maker of the United States. Set up in 1807, it is one of the U.S. governments oldest scientific organizations. In 1878 it was given the name of Coast and Geodetic Survey (C&GS). In 1970 it became part of the National Oceanic and Atmospheric Administration (NOAA).
The agency was established in 1807 when President Thomas Jefferson signed the document entitled An act to provide for surveying the coasts of the United States. While the bills objective was specific—to produce nautical charts—it reflected larger issues of concern to the new nation: national boundaries, commerce, and defence.
The early years were difficult. Ferdinand Rudolph Hassler, who was eventually to become the agencys first superintendent, went to England to collect scientific instruments but was unable to return through the duration of the War of 1812. After his return, he worked on a survey of the New York Harbor in 1817, but Congress stepped in to suspend the work because of tensions between civilian and military control of the agency. After several years under the control of the U.S. Army, the Survey of the Coast was reestablished in 1832, and President Andrew Jackson appointed Hassler as superintendent.
The U.S. Coast Survey was a civilian agency but, from the beginning, members of the Navy and Army were detailed to service with the Survey, and Navy ships were also detailed to its use. In general, army officers worked on topographic surveys on the land and maps based on the surveys, while navy officers worked on hydrographic surveys in coastal waters.
Alexander Dallas Bache, great-grandson of Benjamin Franklin, was the second Coast Survey superintendent. Bache was a physicist, scientist, and surveyor who established the first magnetic observatory and served as the first president of the National Academy of Sciences. Under Bache, Coast Survey quickly applied its resources to the Union cause during the Civil War. In addition to setting up additional lithographic presses to produce the thousands of charts required by the Navy and other vessels, Bache made a critical decision to send Coast Survey parties to work with blockading squadrons and armies in the field, producing hundreds of maps and charts. Bache detailed these activities in his annual reports to Congress.
Coast Survey cartographer Edwin Hergesheimer created the map showing the density of the slave population in the Southern states.
Bache was also one of four members of the governments Blockade Strategy Board, planning strategy to essentially strangle the South, economically and militarily. On April 16, 1861, President Lincoln issued a proclamation declaring the blockade of ports from South Carolina to Texas. Baches Notes on the Coast provided valuable information for Union naval forces.
Maps were of paramount importance in wartime:
It is certain that accurate maps must form the basis of well-conducted military operations, and that the best time to procure them is not when an attack is impending, or when the army waits, but when there is no hindrance to, or pressure upon, the surveyors. That no coast can be effectively attacked, defended, or blockaded without accurate maps and charts, has been fully proved by the events of the last two years, if, indeed, such a proposition required practical proof.
— Alexander Dallas Bache, 1862 report.
Coast Survey attracted some of the best and brightest scientists and naturalists. It commissioned the naturalist Louis Agassiz to conduct the first scientific study of the Florida reef system. James McNeill Whistler, who went on to paint the iconic Whistlers Mother, was a Coast Survey engraver. The naturalist John Muir was a guide and artist on Survey of the 39th Parallel across the Great Basin of Nevada and Utah.
The agencys men and women (women professionals were hired as early as 1845) led scientific and engineering activities through the decades. In 1926, they started production of aeronautical charts. During the height of the Great Depression, Coast and Geodetic Survey organized surveying parties and field offices that employed over 10,000 people, including many out-of-work engineers.
In World War II, C&GS sent over 1,000 civilian members and more than half of its commissioned officers to serve as hydrographers, artillery surveyors, cartographers, army engineers, intelligence officers, and geophysicists in all theaters of the war. Civilians on the home front produced over 100 million maps and charts for the Allied Forces. Eleven members of the C&GS gave their lives during the war.
Alexander Dallas Bache 1806 – 1867 was an American physicist, scientist, and surveyor who erected coastal fortifications and conducted a detailed survey to map the mid-eastern United States coastline. Originally an army engineer, he later became Superintendent of the U.S. Coast Survey, and built it into the foremost scientific institution in the country before the Civil War.
Alexander Bache was born in Philadelphia, the son of Richard Bache, Jr., and Sophia Burrell Dallas Bache. He came from a prominent family as he was the nephew of Vice-President George M. Dallas and naval hero Alexander J. Dallas. He was the grandson of Secretary of the Treasury Alexander Dallas and was the great-grandson of Benjamin Franklin.
Bache was a professor of natural philosophy and chemistry at the University of Pennsylvania from 1828 to 1841 and again from 1842 to 1843. He spent 1836–1838 in Europe on behalf of the trustees of what became Girard College; he was named president of the college after his return. Abroad, he examined European education systems, and on his return he published a valuable report. From 1839 to 1842, he served as the first president of Central High School of Philadelphia, one of the oldest public high schools in the United States.
In 1843, on the death of Professor Ferdinand Rudolph Hassler, Bache was appointed superintendent of the United States Coast Survey. He convinced the United States Congress of the value of this work and, by means of the liberal aid it granted, he completed the mapping of the whole coast by a skillful division of labor and the erection of numerous observing stations. In addition, magnetic and meteorological data were collected. Bache served as head of the Coast Survey for 24 years (until his death).
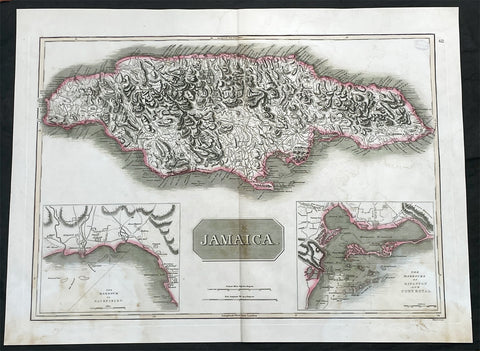
1817 John Thompson Large Antique Map of the Caribbean Island of Jamaica
Antique Map
- Title : Jamaica
- Date : 1817
- Size: 27in x 21in (685mm x 535mm)
- Condition: (A) Very Good Condition
- Ref: 35605
Description:
This large original, beautifully hand coloured copper plate engraved antique map of the Caribbean Islands was published by John Thomson in his large elephant folio 1817 edition of A New General Atlas of the World. (Ref Tooley M&B)
General Definitions:
Paper thickness and quality: - Heavy and stable
Paper color : - off white
Age of map color: - Original
Colors used: - Yellow, green, blue, pink
General color appearance: - Authentic
Paper size: - 27in x 21in (685mm x 535mm)
Plate size: - 27in x 21in (685mm x 535mm)
Margins: - Min 1/2in (12mm)
Imperfections:
Margins: - Light age toning
Plate area: - Light age toning, small library stamp to right
Verso: - Age toning

1861 Migeon Large Antique Map of North America, inset of Niagara Falls
- Title : Amerique Septentrionale
- Date : 1861
- Condition: (A+) Fine Condition
- Ref: 60567
- Size: 18in x 13 1/2in (460mm x 345mm)
Description:
This large fine beautifully hand coloured original antique map of North America - with an inset view of Niagara Falls - was published by J Migeon in his 1861 edition of Geographer Universal. (Ref: M&B; Tooley)
General Description:
Paper thickness and quality: - Heavy & stable
Paper color: - White
Age of map color: - Original
Colors used: - Pink, yellow, green, blue
General color appearance: - Authentic
Paper size: - 18in x 13 1/2in (460mm x 345mm)
Plate size: - 18in x 13 1/2in (460mm x 345mm)
Margins: - Min 1in (25mm)
Imperfections:
Margins: - None
Plate area: - None
Verso: - None
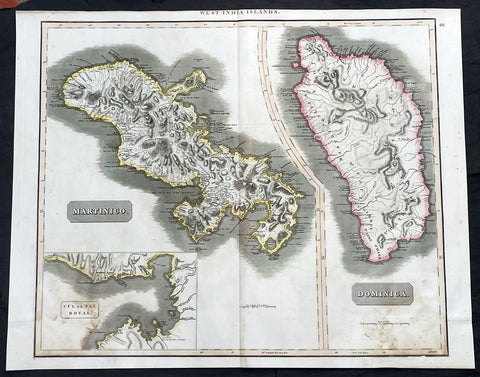
1817 John Thompson Large Antique Map Caribbean Islands of Martinique & Dominica
Antique Map
- Title : West India Islands: Martinico (Cul de Sac Royal); Dominica
- Date : 1817
- Size: 27in x 21in (685mm x 535mm)
- Condition: (A) Very Good Condition
- Ref: 35606
Description:
This large original, beautifully hand coloured copper plate engraved antique map of the Caribbean Islands of Martinique and Dominica was published by John Thomson in his large elephant folio 1817 edition of A New General Atlas of the World. (Ref Tooley M&B)
General Definitions:
Paper thickness and quality: - Heavy and stable
Paper color : - off white
Age of map color: - Original
Colors used: - Yellow, green, blue, pink
General color appearance: - Authentic
Paper size: - 27in x 21in (685mm x 535mm)
Plate size: - 27in x 21in (685mm x 535mm)
Margins: - Min 1/2in (12mm)
Imperfections:
Margins: - Bottom L&R margins extended from borders, not affecting the image
Plate area: - Light age toning
Verso: - Age toning
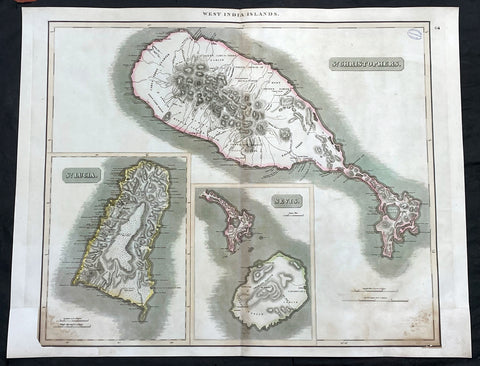
1817 John Thompson Large Antique Map Caribbean Is. St Christopher St Lucia Nevis
Antique Map
- Title : West India Islands: St Christopher; St Lucia; Nevis
- Date : 1817
- Size: 27in x 21in (685mm x 535mm)
- Condition: (A) Very Good Condition
- Ref: 35609
Description:
This large original, beautifully hand coloured copper plate engraved antique map of the Caribbean Islands was published by John Thomson in his large elephant folio 1817 edition of A New General Atlas of the World. (Ref Tooley M&B)
General Definitions:
Paper thickness and quality: - Heavy and stable
Paper color : - off white
Age of map color: - Original
Colors used: - Yellow, green, blue, pink
General color appearance: - Authentic
Paper size: - 27in x 21in (685mm x 535mm)
Plate size: - 27in x 21in (685mm x 535mm)
Margins: - Min 1/2in (12mm)
Imperfections:
Margins: - Bottom L&R margins extended from borders, not affecting the image
Plate area: - Light age toning, small library stamp to right
Verso: - Age toning
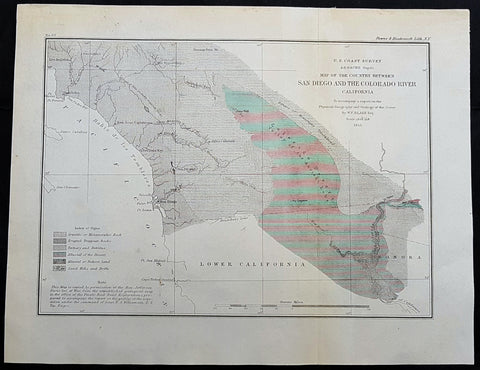
1855 US Coast Survey & A D Bache Antique Map Lower Colorado River Valley & San Diego, California
- Title : US Coast Survey A D Bache Superintendant Map of the Vicinity of Monterey Bay California...By W P Blake esq. 1855
- Size: 12in x 9in (305mm x 230mm)
- Condition: (A+) Fine Condition
- Date : 1855
- Ref #: 93018
This original antique lithograph map of the lower Colorado River Valley and San Diego, by Alexander Dallas Bache (great-grandson of Benjamin Franklin) in 1855 - dated - was published by the official chart-maker of the United States, the office of The US Coast Survey.
General Definitions:
Paper thickness and quality: - Heavy and stable
Paper color : - off white
Age of map color: -
Colors used: -
General color appearance: -
Paper size: - 12in x 9in (305mm x 230mm)
Plate size: - 12in x 9in (305mm x 230mm)
Margins: - Min 1/2in (12mm)
Imperfections:
Margins: - None
Plate area: - None
Verso: - None
Background:
The Colorado River is a major river of the western United States and northwest Mexico in North America. Its headwaters are in the Rocky Mountains where La Poudre Pass Lake is its source. Located in north central Colorado it flows southwest through the Colorado Plateau country of western Colorado, southeastern Utah and northwestern Arizona where it flows through the Grand Canyon. It turns south near Las Vegas, Nevada, forming the Arizona–Nevada border in Lake Mead and the Arizona–California border a few miles below Davis Dam between Laughlin, Nevada and Needles, California California before entering Mexico in the Colorado Desert. Most of its waters are diverted into the Imperial Valley of Southern California. In Mexico its course forms the boundary between Sonora and Baja California before entering the Gulf of California.
The Colorado forms the border of California to the west and Arizona to the east for most of its course through the desert Lower Colorado River Valley (LCRV), where its character changes significantly from fast-flowing whitewater to a low gradient braided stream with a wide floodplain. Here, the Colorado River ranges in width from 700 to 2,500 ft (200 to 800 m) and from 8 to 100 ft (2 to 30 m) in depth. It becomes a losing stream, with a gradual reduction in volume both due to evaporation in the hot desert climate and massive diversions for irrigation, urban areas, industry and thermo-electric power generation. The average flow rate of 14,180 cubic feet per second (402 m3/s) at Davis Dam diminishes to just 2,060 cubic feet per second (58 m3/s) at the Mexican border.
At Needles, California the Colorado is crossed by Interstate 40; shortly downstream it passes the Topock Marsh in Topock Gorge and widens into Lake Havasu, formed by Parker Dam. Lake Havasu provides recreation as well as the home of the retired U.K. London Bridge in Lake Havasu City, Arizona, now the New London Bridge. Near Parker Dam are the first two major diversions of the lower Colorado: the Colorado River Aqueduct, which travels 240 miles (390 km) west to Los Angeles and San Diego, California; and the Central Arizona Project, which sends water 340 miles (550 km) east towards Phoenix and Tucson, Arizona. The intermittent Bill Williams River joins the Colorado from the east in Lake Havasu, just above Parker Dam.
U.S. Coast Survey (Office of Coast Survey)
The Office of Coast Survey is the official chart-maker of the United States. Set up in 1807, it is one of the U.S. governments oldest scientific organizations. In 1878 it was given the name of Coast and Geodetic Survey (C&GS). In 1970 it became part of the National Oceanic and Atmospheric Administration (NOAA).
The agency was established in 1807 when President Thomas Jefferson signed the document entitled An act to provide for surveying the coasts of the United States. While the bills objective was specific—to produce nautical charts—it reflected larger issues of concern to the new nation: national boundaries, commerce, and defence.
The early years were difficult. Ferdinand Rudolph Hassler, who was eventually to become the agencys first superintendent, went to England to collect scientific instruments but was unable to return through the duration of the War of 1812. After his return, he worked on a survey of the New York Harbor in 1817, but Congress stepped in to suspend the work because of tensions between civilian and military control of the agency. After several years under the control of the U.S. Army, the Survey of the Coast was reestablished in 1832, and President Andrew Jackson appointed Hassler as superintendent.
The U.S. Coast Survey was a civilian agency but, from the beginning, members of the Navy and Army were detailed to service with the Survey, and Navy ships were also detailed to its use. In general, army officers worked on topographic surveys on the land and maps based on the surveys, while navy officers worked on hydrographic surveys in coastal waters.
Alexander Dallas Bache, great-grandson of Benjamin Franklin, was the second Coast Survey superintendent. Bache was a physicist, scientist, and surveyor who established the first magnetic observatory and served as the first president of the National Academy of Sciences. Under Bache, Coast Survey quickly applied its resources to the Union cause during the Civil War. In addition to setting up additional lithographic presses to produce the thousands of charts required by the Navy and other vessels, Bache made a critical decision to send Coast Survey parties to work with blockading squadrons and armies in the field, producing hundreds of maps and charts. Bache detailed these activities in his annual reports to Congress.
Coast Survey cartographer Edwin Hergesheimer created the map showing the density of the slave population in the Southern states.
Bache was also one of four members of the governments Blockade Strategy Board, planning strategy to essentially strangle the South, economically and militarily. On April 16, 1861, President Lincoln issued a proclamation declaring the blockade of ports from South Carolina to Texas. Baches Notes on the Coast provided valuable information for Union naval forces.
Maps were of paramount importance in wartime:
It is certain that accurate maps must form the basis of well-conducted military operations, and that the best time to procure them is not when an attack is impending, or when the army waits, but when there is no hindrance to, or pressure upon, the surveyors. That no coast can be effectively attacked, defended, or blockaded without accurate maps and charts, has been fully proved by the events of the last two years, if, indeed, such a proposition required practical proof.
— Alexander Dallas Bache, 1862 report.
Coast Survey attracted some of the best and brightest scientists and naturalists. It commissioned the naturalist Louis Agassiz to conduct the first scientific study of the Florida reef system. James McNeill Whistler, who went on to paint the iconic Whistlers Mother, was a Coast Survey engraver. The naturalist John Muir was a guide and artist on Survey of the 39th Parallel across the Great Basin of Nevada and Utah.
The agencys men and women (women professionals were hired as early as 1845) led scientific and engineering activities through the decades. In 1926, they started production of aeronautical charts. During the height of the Great Depression, Coast and Geodetic Survey organized surveying parties and field offices that employed over 10,000 people, including many out-of-work engineers.
In World War II, C&GS sent over 1,000 civilian members and more than half of its commissioned officers to serve as hydrographers, artillery surveyors, cartographers, army engineers, intelligence officers, and geophysicists in all theaters of the war. Civilians on the home front produced over 100 million maps and charts for the Allied Forces. Eleven members of the C&GS gave their lives during the war.
Alexander Dallas Bache 1806 – 1867 was an American physicist, scientist, and surveyor who erected coastal fortifications and conducted a detailed survey to map the mid-eastern United States coastline. Originally an army engineer, he later became Superintendent of the U.S. Coast Survey, and built it into the foremost scientific institution in the country before the Civil War.
Alexander Bache was born in Philadelphia, the son of Richard Bache, Jr., and Sophia Burrell Dallas Bache. He came from a prominent family as he was the nephew of Vice-President George M. Dallas and naval hero Alexander J. Dallas. He was the grandson of Secretary of the Treasury Alexander Dallas and was the great-grandson of Benjamin Franklin.
Bache was a professor of natural philosophy and chemistry at the University of Pennsylvania from 1828 to 1841 and again from 1842 to 1843. He spent 1836–1838 in Europe on behalf of the trustees of what became Girard College; he was named president of the college after his return. Abroad, he examined European education systems, and on his return he published a valuable report. From 1839 to 1842, he served as the first president of Central High School of Philadelphia, one of the oldest public high schools in the United States.
In 1843, on the death of Professor Ferdinand Rudolph Hassler, Bache was appointed superintendent of the United States Coast Survey. He convinced the United States Congress of the value of this work and, by means of the liberal aid it granted, he completed the mapping of the whole coast by a skillful division of labor and the erection of numerous observing stations. In addition, magnetic and meteorological data were collected. Bache served as head of the Coast Survey for 24 years (until his death).
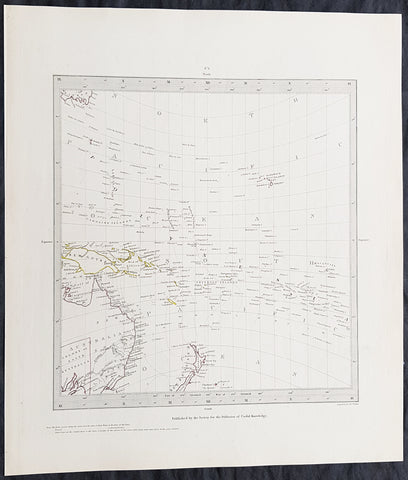
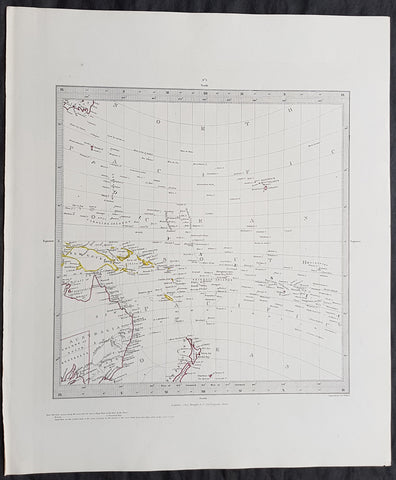
1840 SDUK Antique Gnomonic Map East Australia, New Zealand South Pacific
- Title : Published by the Society for the Diffusion of Useful Knowledge
- Size: 16in x 14in (410mm x 355m)
- Condition: (A+) Fine Condition
- Date : 1840
- Ref #: 24676-1
Description:
This hand coloured original steel-plate engraved antique Gnomonic Map of eastern Australia, New Zealand & The South Pacific was engraved by J & C Walker, in 1840 and was published in the Chapman & Hall edition of the Society For the Diffusion of Useful Knowledge (SDUK) Atlas.
A gnomonic map projection displays all great circles as straight lines, resulting in any line segment on a gnomonic map showing a geodesic, the shortest route between the segment\'s two endpoints. This is achieved by casting surface points of the sphere onto a tangent plane, each landing where a ray from the center of the sphere passes through the point on the surface and then on to the plane. No distortion occurs at the tangent point, but distortion increases rapidly away from it. Less than half of the sphere can be projected onto a finite map. Consequently a rectilinear photographic lens cannot image more than 180 degrees.
General Definitions:
Paper thickness and quality: - Heavy and stable
Paper color : - off white
Age of map color: - Original
Colors used: - Yellow, pink, green, blue
General color appearance: - Authentic
Paper size: - 16in x 14in (410mm x 355m)
Plate size: - 16in x 14in (410mm x 355m)
Margins: - Min 1/4in (5mm)
Imperfections:
Margins: - Light age toning
Plate area: - None
Verso: - None
Background:
The SDUK produced two landmark volumes of cartography in the first half of the 19th century. The first volume concentrated on areas of the old world, Europe, Africa, Great Britain etc. The second volume contained maps of the new world, America, South Asia, including US state maps, colonies of Australia, South Africa, South America etc. Also included were some of the finest engraved town and city plans published at that time.
The SDUK was published in its entirety or in part by many publishers including Baldwin and Cradock 1829-32, Chapman & Hall in 1844, Charles Knight & co. 1846 – 1852. G. Cox published the SDUK between 1852-3, Stanford 1857-70 and later revised edition were also published after Stanford. (Ref: Tooley, M&B)
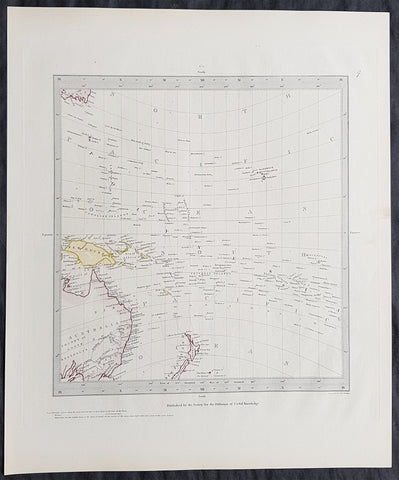
Copy of 1840 SDUK Antique Gnomonic Map East Australia, New Zealand South Pacific
- Title : Published by the Society for the Diffusion of Useful Knowledge
- Size: 16in x 14in (410mm x 355m)
- Condition: (A+) Fine Condition
- Date : 1840
- Ref #: 11-0984
Description:
This hand coloured original steel-plate engraved antique Gnomonic Map of eastern Australia, New Zealand & The South Pacific was engraved by J & C Walker, in 1840 and was published in the Chapman & Hall edition of the Society For the Diffusion of Useful Knowledge (SDUK) Atlas.
A gnomonic map projection displays all great circles as straight lines, resulting in any line segment on a gnomonic map showing a geodesic, the shortest route between the segment\'s two endpoints. This is achieved by casting surface points of the sphere onto a tangent plane, each landing where a ray from the center of the sphere passes through the point on the surface and then on to the plane. No distortion occurs at the tangent point, but distortion increases rapidly away from it. Less than half of the sphere can be projected onto a finite map. Consequently a rectilinear photographic lens cannot image more than 180 degrees.
General Definitions:
Paper thickness and quality: - Heavy and stable
Paper color : - off white
Age of map color: - Original
Colors used: - Yellow, pink, green, blue
General color appearance: - Authentic
Paper size: - 16in x 14in (410mm x 355m)
Plate size: - 16in x 14in (410mm x 355m)
Margins: - Min 1/4in (5mm)
Imperfections:
Margins: - Light age toning
Plate area: - None
Verso: - None
Background:
The SDUK produced two landmark volumes of cartography in the first half of the 19th century. The first volume concentrated on areas of the old world, Europe, Africa, Great Britain etc. The second volume contained maps of the new world, America, South Asia, including US state maps, colonies of Australia, South Africa, South America etc. Also included were some of the finest engraved town and city plans published at that time.
The SDUK was published in its entirety or in part by many publishers including Baldwin and Cradock 1829-32, Chapman & Hall in 1844, Charles Knight & co. 1846 – 1852. G. Cox published the SDUK between 1852-3, Stanford 1857-70 and later revised edition were also published after Stanford. (Ref: Tooley, M&B)
1840 SDUK Antique Gnomonic Map East Australia, New Zealand South Pacific
- Title : Published by the Society for the Diffusion of Useful Knowledge
- Size: 16in x 14in (410mm x 355m)
- Condition: (A+) Fine Condition
- Date : 1840
- Ref #: 11-0974
Description:
This hand coloured original steel-plate engraved antique Gnomonic Map of eastern Australia, New Zealand & The South Pacific was engraved by J & C Walker, in 1840 and was published in the Chapman & Hall edition of the Society For the Diffusion of Useful Knowledge (SDUK) Atlas.
A gnomonic map projection displays all great circles as straight lines, resulting in any line segment on a gnomonic map showing a geodesic, the shortest route between the segment\'s two endpoints. This is achieved by casting surface points of the sphere onto a tangent plane, each landing where a ray from the center of the sphere passes through the point on the surface and then on to the plane. No distortion occurs at the tangent point, but distortion increases rapidly away from it. Less than half of the sphere can be projected onto a finite map. Consequently a rectilinear photographic lens cannot image more than 180 degrees.
General Definitions:
Paper thickness and quality: - Heavy and stable
Paper color : - off white
Age of map color: - Original
Colors used: - Yellow, pink, green, blue
General color appearance: - Authentic
Paper size: - 16in x 14in (410mm x 355m)
Plate size: - 16in x 14in (410mm x 355m)
Margins: - Min 1/4in (5mm)
Imperfections:
Margins: - Light age toning
Plate area: - None
Verso: - None
Background:
The SDUK produced two landmark volumes of cartography in the first half of the 19th century. The first volume concentrated on areas of the old world, Europe, Africa, Great Britain etc. The second volume contained maps of the new world, America, South Asia, including US state maps, colonies of Australia, South Africa, South America etc. Also included were some of the finest engraved town and city plans published at that time.
The SDUK was published in its entirety or in part by many publishers including Baldwin and Cradock 1829-32, Chapman & Hall in 1844, Charles Knight & co. 1846 – 1852. G. Cox published the SDUK between 1852-3, Stanford 1857-70 and later revised edition were also published after Stanford. (Ref: Tooley, M&B)
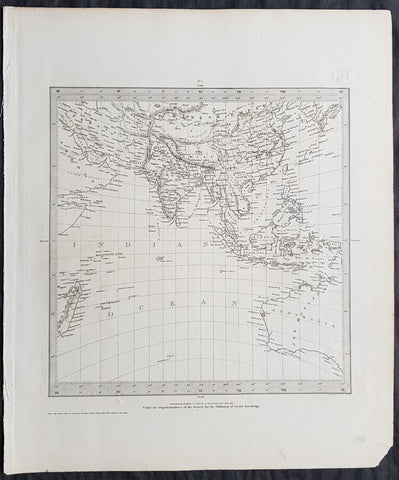
1831 SDUK Antique Gnomonic Map of Western Australia & The Indian Ocean, SE Asia
- Title : Published by Baldwin & Craddock...June 1831
- Size: 16in x 14in (410mm x 355m)
- Condition: (A+) Fine Condition
- Date : 1831
- Ref #: 32534
Description:
This original steel-plate engraved antique Gnomonic Map of Western Australia & The Indian Ocean was engraved by J & C Walker, in 1831 - dated at the foot of the map - and was published in the Baldwin & Craddock edition of the Society For the Diffusion of Useful Knowledge (SDUK) Atlas.
A gnomonic map projection displays all great circles as straight lines, resulting in any line segment on a gnomonic map showing a geodesic, the shortest route between the segment\'s two endpoints. This is achieved by casting surface points of the sphere onto a tangent plane, each landing where a ray from the center of the sphere passes through the point on the surface and then on to the plane. No distortion occurs at the tangent point, but distortion increases rapidly away from it. Less than half of the sphere can be projected onto a finite map. Consequently a rectilinear photographic lens cannot image more than 180 degrees.
General Definitions:
Paper thickness and quality: - Heavy and stable
Paper color : - off white
Age of map color: -
Colors used: -
General color appearance: -
Paper size: - 16in x 14in (410mm x 355m)
Plate size: - 16in x 14in (410mm x 355m)
Margins: - Min 1/4in (5mm)
Imperfections:
Margins: - None
Plate area: - Blind Library stamp
Verso: - None
Background:
The SDUK produced two landmark volumes of cartography in the first half of the 19th century. The first volume concentrated on areas of the old world, Europe, Africa, Great Britain etc. The second volume contained maps of the new world, America, South Asia, including US state maps, colonies of Australia, South Africa, South America etc. Also included were some of the finest engraved town and city plans published at that time.
The SDUK was published in its entirety or in part by many publishers including Baldwin and Cradock 1829-32, Chapman & Hall in 1844, Charles Knight & co. 1846 – 1852. G. Cox published the SDUK between 1852-3, Stanford 1857-70 and later revised edition were also published after Stanford. (Ref: Tooley, M&B)
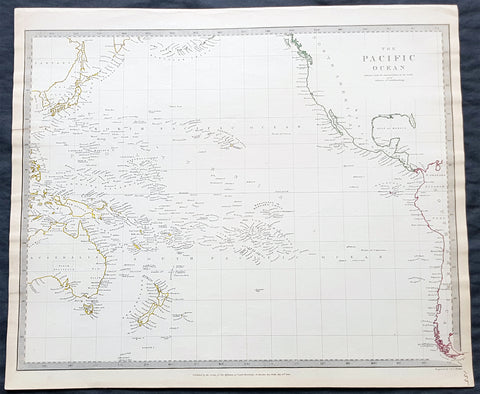
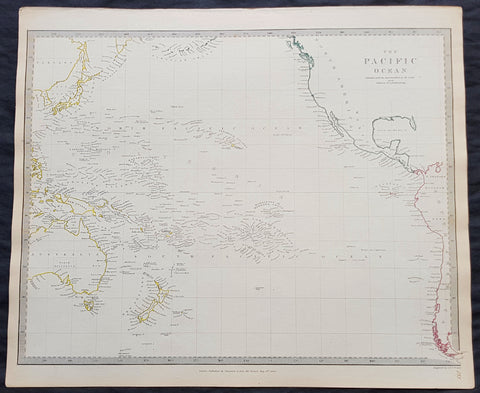
1840 SDUK Antique Map of The Pacific Ocean, North America, Japan, Australia, New Zealand
- Title : The Pacific Ocean.....Published by Chapman & Hall...May 15th 1840
- Size: 16in x 14in (410mm x 355m)
- Condition: (A+) Fine Condition
- Date : 1840
- Ref #: 24668
Description:
This hand coloured original steel-plate engraved antique map of The Pacific Ocean from North America, Japan, Australia & New Zealand was engraved by J & C Walker, in 1840 - the date is engraved at the foot of the map - and was published in the Chapman & Hall edition of the Society For the Diffusion of Useful Knowledge (SDUK) Atlas.
General Definitions:
Paper thickness and quality: - Heavy and stable
Paper color : - off white
Age of map color: - Original
Colors used: - Yellow, pink, green, blue
General color appearance: - Authentic
Paper size: - 16in x 14in (410mm x 355m)
Plate size: - 16in x 14in (410mm x 355m)
Margins: - Min 1/4in (5mm)
Imperfections:
Margins: - Light age toning
Plate area: - None
Verso: - None
Background:
The SDUK produced two landmark volumes of cartography in the first half of the 19th century. The first volume concentrated on areas of the old world, Europe, Africa, Great Britain etc. The second volume contained maps of the new world, America, South Asia, including US state maps, colonies of Australia, South Africa, South America etc. Also included were some of the finest engraved town and city plans published at that time.
The SDUK was published in its entirety or in part by many publishers including Baldwin and Cradock 1829-32, Chapman & Hall in 1844, Charles Knight & co. 1846 – 1852. G. Cox published the SDUK between 1852-3, Stanford 1857-70 and later revised edition were also published after Stanford. (Ref: Tooley, M&B)
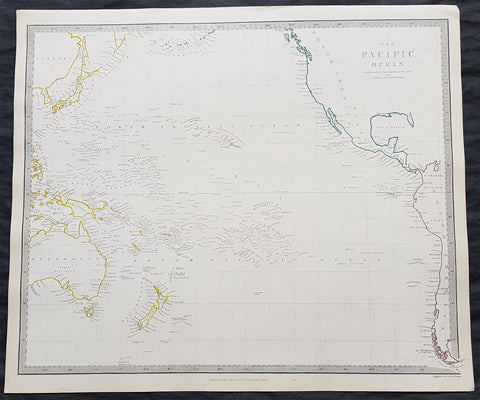
1840 SDUK Antique Map of The Pacific Ocean, North America, Japan, Australia, New Zealand
- Title : The Pacific Ocean.....Published by Chapman & Hall...May 15th 1840
- Size: 16in x 14in (410mm x 355m)
- Condition: (A+) Fine Condition
- Date : 1840
- Ref #: 11-0954-1
Description:
This hand coloured original steel-plate engraved antique map of The Pacific Ocean from North America, Japan, Australia & New Zealand was engraved by J & C Walker, in 1840 - the date is engraved at the foot of the map - and was published in the Chapman & Hall edition of the Society For the Diffusion of Useful Knowledge (SDUK) Atlas.
General Definitions:
Paper thickness and quality: - Heavy and stable
Paper color : - off white
Age of map color: - Original
Colors used: - Yellow, pink, green, blue
General color appearance: - Authentic
Paper size: - 16in x 14in (410mm x 355m)
Plate size: - 16in x 14in (410mm x 355m)
Margins: - Min 1/4in (5mm)
Imperfections:
Margins: - Light age toning
Plate area: - None
Verso: - None
Background:
The SDUK produced two landmark volumes of cartography in the first half of the 19th century. The first volume concentrated on areas of the old world, Europe, Africa, Great Britain etc. The second volume contained maps of the new world, America, South Asia, including US state maps, colonies of Australia, South Africa, South America etc. Also included were some of the finest engraved town and city plans published at that time.
The SDUK was published in its entirety or in part by many publishers including Baldwin and Cradock 1829-32, Chapman & Hall in 1844, Charles Knight & co. 1846 – 1852. G. Cox published the SDUK between 1852-3, Stanford 1857-70 and later revised edition were also published after Stanford. (Ref: Tooley, M&B)
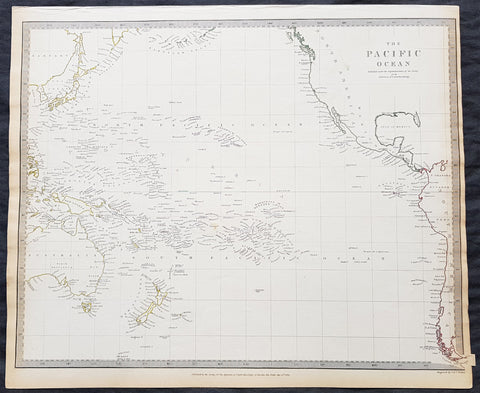
1840 SDUK Antique Map of The Pacific Ocean, North America, Japan, Australia, New Zealand
- Title : The Pacific Ocean.....Published by Chapman & Hall...May 15th 1840
- Size: 16in x 14in (410mm x 355m)
- Condition: (A+) Fine Condition
- Date : 1840
- Ref #: 11-0964
Description:
This hand coloured original steel-plate engraved antique map of The Pacific Ocean from North America, Japan, Australia & New Zealand was engraved by J & C Walker, in 1840 - the date is engraved at the foot of the map - and was published in the Chapman & Hall edition of the Society For the Diffusion of Useful Knowledge (SDUK) Atlas.
General Definitions:
Paper thickness and quality: - Heavy and stable
Paper color : - off white
Age of map color: - Original
Colors used: - Yellow, pink, green, blue
General color appearance: - Authentic
Paper size: - 16in x 14in (410mm x 355m)
Plate size: - 16in x 14in (410mm x 355m)
Margins: - Min 1/4in (5mm)
Imperfections:
Margins: - Light age toning
Plate area: - None
Verso: - None
Background:
The SDUK produced two landmark volumes of cartography in the first half of the 19th century. The first volume concentrated on areas of the old world, Europe, Africa, Great Britain etc. The second volume contained maps of the new world, America, South Asia, including US state maps, colonies of Australia, South Africa, South America etc. Also included were some of the finest engraved town and city plans published at that time.
The SDUK was published in its entirety or in part by many publishers including Baldwin and Cradock 1829-32, Chapman & Hall in 1844, Charles Knight & co. 1846 – 1852. G. Cox published the SDUK between 1852-3, Stanford 1857-70 and later revised edition were also published after Stanford. (Ref: Tooley, M&B)
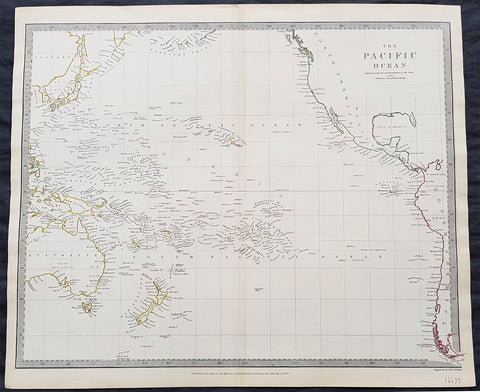
1840 SDUK Antique Map of The Pacific Ocean, North America, Japan, Australia, New Zealand
- Title : The Pacific Ocean.....Published by Chapman & Hall...May 15th 1840
- Size: 16in x 14in (410mm x 355m)
- Condition: (A+) Fine Condition
- Date : 1840
- Ref #: 91362
Description:
This hand coloured original steel-plate engraved antique map of The Pacific Ocean from North America, Japan, Australia & New Zealand was engraved by J & C Walker, in 1840 - the date is engraved at the foot of the map - and was published in the Chapman & Hall edition of the Society For the Diffusion of Useful Knowledge (SDUK) Atlas.
General Definitions:
Paper thickness and quality: - Heavy and stable
Paper color : - off white
Age of map color: - Original
Colors used: - Yellow, pink, green, blue
General color appearance: - Authentic
Paper size: - 16in x 14in (410mm x 355m)
Plate size: - 16in x 14in (410mm x 355m)
Margins: - Min 1/4in (5mm)
Imperfections:
Margins: - Light age toning
Plate area: - None
Verso: - None
Background:
The SDUK produced two landmark volumes of cartography in the first half of the 19th century. The first volume concentrated on areas of the old world, Europe, Africa, Great Britain etc. The second volume contained maps of the new world, America, South Asia, including US state maps, colonies of Australia, South Africa, South America etc. Also included were some of the finest engraved town and city plans published at that time.
The SDUK was published in its entirety or in part by many publishers including Baldwin and Cradock 1829-32, Chapman & Hall in 1844, Charles Knight & co. 1846 – 1852. G. Cox published the SDUK between 1852-3, Stanford 1857-70 and later revised edition were also published after Stanford. (Ref: Tooley, M&B)
1840 SDUK Antique Map of The Pacific Ocean, North America, Japan, Australia, New Zealand
- Title : The Pacific Ocean.....Published by Chapman & Hall...May 15th 1840
- Size: 16in x 14in (410mm x 355m)
- Condition: (A+) Fine Condition
- Date : 1840
- Ref #: 31980
Description:
This hand coloured original steel-plate engraved antique map of The Pacific Ocean from North America, Japan, Australia & New Zealand was engraved by J & C Walker, in 1840 - the date is engraved at the foot of the map - and was published in the Chapman & Hall edition of the Society For the Diffusion of Useful Knowledge (SDUK) Atlas.
General Definitions:
Paper thickness and quality: - Heavy and stable
Paper color : - off white
Age of map color: - Original
Colors used: - Yellow, pink, green, blue
General color appearance: - Authentic
Paper size: - 16in x 14in (410mm x 355m)
Plate size: - 16in x 14in (410mm x 355m)
Margins: - Min 1/4in (5mm)
Imperfections:
Margins: - Light age toning
Plate area: - None
Verso: - None
Background:
The SDUK produced two landmark volumes of cartography in the first half of the 19th century. The first volume concentrated on areas of the old world, Europe, Africa, Great Britain etc. The second volume contained maps of the new world, America, South Asia, including US state maps, colonies of Australia, South Africa, South America etc. Also included were some of the finest engraved town and city plans published at that time.
The SDUK was published in its entirety or in part by many publishers including Baldwin and Cradock 1829-32, Chapman & Hall in 1844, Charles Knight & co. 1846 – 1852. G. Cox published the SDUK between 1852-3, Stanford 1857-70 and later revised edition were also published after Stanford. (Ref: Tooley, M&B)
1856 A D Bache Scarce Antique Map of San Clemente Island, San Diego, California
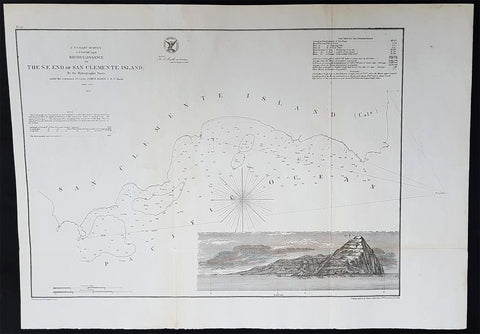
- Title : US Coast Survey A D Bache Supt Reconnaissance of The SE End of San Clemente Island...1856
- Size: 20 1/2in x 14in (520mm x 360mm)
- Condition: (A+) Fine Condition
- Date : 1856
- Ref #: 93028
Description:
This large rare, original lithograph early antique map of San Clemente Island, off San Diego, California by Alexander Dallas Bache (great-grandson of Benjamin Franklin) in 1856 - dated - was published by the official chart-maker of the United States, the office of The US Coast Survey.
The Office of the Coast Survey, founded in 1807 by President Thomas Jefferson and Secretary of Commerce Albert Gallatin, is the oldest scientific organization in the U.S. Federal Government. Jefferson created the Survey of the Coast, as it was then called, in response to a need for accurate navigational charts of the new nation\\\'s coasts and harbors.
General Definitions:
Paper thickness and quality: - Heavy and stable
Paper color : - off white
Age of map color: -
Colors used: -
General color appearance: -
Paper size: - 20 1/2in x 14in (520mm x 360mm)
Plate size: - 20 1/2in x 14in (520mm x 360mm)
Margins: - Min 1/2in (12mm)
Imperfections:
Margins: - None
Plate area: - Folds as issued, light age toning
Verso: - Some folds re-enforced with archival tape
U.S. Coast Survey (Office of Coast Survey)
The Office of Coast Survey is the official chart-maker of the United States. Set up in 1807, it is one of the U.S. governments oldest scientific organizations. In 1878 it was given the name of Coast and Geodetic Survey (C&GS). In 1970 it became part of the National Oceanic and Atmospheric Administration (NOAA).
The agency was established in 1807 when President Thomas Jefferson signed the document entitled An act to provide for surveying the coasts of the United States. While the bills objective was specific—to produce nautical charts—it reflected larger issues of concern to the new nation: national boundaries, commerce, and defence.
The early years were difficult. Ferdinand Rudolph Hassler, who was eventually to become the agencys first superintendent, went to England to collect scientific instruments but was unable to return through the duration of the War of 1812. After his return, he worked on a survey of the New York Harbor in 1817, but Congress stepped in to suspend the work because of tensions between civilian and military control of the agency. After several years under the control of the U.S. Army, the Survey of the Coast was reestablished in 1832, and President Andrew Jackson appointed Hassler as superintendent.
The U.S. Coast Survey was a civilian agency but, from the beginning, members of the Navy and Army were detailed to service with the Survey, and Navy ships were also detailed to its use. In general, army officers worked on topographic surveys on the land and maps based on the surveys, while navy officers worked on hydrographic surveys in coastal waters.
Alexander Dallas Bache, great-grandson of Benjamin Franklin, was the second Coast Survey superintendent. Bache was a physicist, scientist, and surveyor who established the first magnetic observatory and served as the first president of the National Academy of Sciences. Under Bache, Coast Survey quickly applied its resources to the Union cause during the Civil War. In addition to setting up additional lithographic presses to produce the thousands of charts required by the Navy and other vessels, Bache made a critical decision to send Coast Survey parties to work with blockading squadrons and armies in the field, producing hundreds of maps and charts. Bache detailed these activities in his annual reports to Congress.
Coast Survey cartographer Edwin Hergesheimer created the map showing the density of the slave population in the Southern states.
Bache was also one of four members of the governments Blockade Strategy Board, planning strategy to essentially strangle the South, economically and militarily. On April 16, 1861, President Lincoln issued a proclamation declaring the blockade of ports from South Carolina to Texas. Baches Notes on the Coast provided valuable information for Union naval forces.
Maps were of paramount importance in wartime:
It is certain that accurate maps must form the basis of well-conducted military operations, and that the best time to procure them is not when an attack is impending, or when the army waits, but when there is no hindrance to, or pressure upon, the surveyors. That no coast can be effectively attacked, defended, or blockaded without accurate maps and charts, has been fully proved by the events of the last two years, if, indeed, such a proposition required practical proof.
— Alexander Dallas Bache, 1862 report.
Coast Survey attracted some of the best and brightest scientists and naturalists. It commissioned the naturalist Louis Agassiz to conduct the first scientific study of the Florida reef system. James McNeill Whistler, who went on to paint the iconic Whistlers Mother, was a Coast Survey engraver. The naturalist John Muir was a guide and artist on Survey of the 39th Parallel across the Great Basin of Nevada and Utah.
The agencys men and women (women professionals were hired as early as 1845) led scientific and engineering activities through the decades. In 1926, they started production of aeronautical charts. During the height of the Great Depression, Coast and Geodetic Survey organized surveying parties and field offices that employed over 10,000 people, including many out-of-work engineers.
In World War II, C&GS sent over 1,000 civilian members and more than half of its commissioned officers to serve as hydrographers, artillery surveyors, cartographers, army engineers, intelligence officers, and geophysicists in all theaters of the war. Civilians on the home front produced over 100 million maps and charts for the Allied Forces. Eleven members of the C&GS gave their lives during the war.
Alexander Dallas Bache 1806 – 1867 was an American physicist, scientist, and surveyor who erected coastal fortifications and conducted a detailed survey to map the mid-eastern United States coastline. Originally an army engineer, he later became Superintendent of the U.S. Coast Survey, and built it into the foremost scientific institution in the country before the Civil War.
Alexander Bache was born in Philadelphia, the son of Richard Bache, Jr., and Sophia Burrell Dallas Bache. He came from a prominent family as he was the nephew of Vice-President George M. Dallas and naval hero Alexander J. Dallas. He was the grandson of Secretary of the Treasury Alexander Dallas and was the great-grandson of Benjamin Franklin.
Bache was a professor of natural philosophy and chemistry at the University of Pennsylvania from 1828 to 1841 and again from 1842 to 1843. He spent 1836–1838 in Europe on behalf of the trustees of what became Girard College; he was named president of the college after his return. Abroad, he examined European education systems, and on his return he published a valuable report. From 1839 to 1842, he served as the first president of Central High School of Philadelphia, one of the oldest public high schools in the United States.
In 1843, on the death of Professor Ferdinand Rudolph Hassler, Bache was appointed superintendent of the United States Coast Survey. He convinced the United States Congress of the value of this work and, by means of the liberal aid it granted, he completed the mapping of the whole coast by a skillful division of labor and the erection of numerous observing stations. In addition, magnetic and meteorological data were collected. Bache served as head of the Coast Survey for 24 years (until his death).
1842 William Mather Antique Cross Section Geology Print The Island of New York
Antique Map
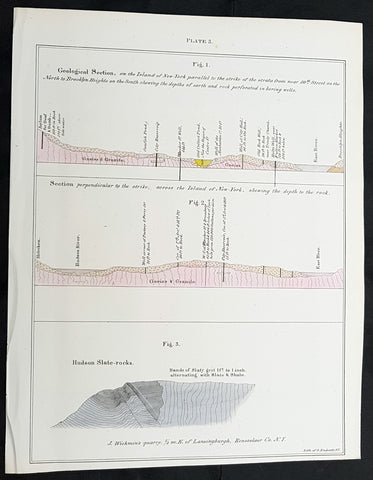
- Title : Geological Section, on the Island of New York.....
- Size: 11 1/2in x 9in (280mm x 230mm)
- Condition: (A+) Fine Condition
- Date : 1842
- Ref #: 93063
Description:
This original hand coloured antique lithograph of 3 cross sectional geological maps, views on the Island of New York by the Endicott company, was published in the 1842 edition of William Mathers Geology of New York
General Definitions:
Paper thickness and quality: - Heavy and stable
Paper color : - off white
Age of map color: - Original
Colors used: - Yellow
General color appearance: - Authentic
Paper size: - 11 1/2in x 9in (280mm x 230mm)
Plate size: - 11 1/2in x 9in (280mm x 230mm)
Margins: - Min 1/2in (12mm)
Imperfections:
Margins: - None
Plate area: - None
Verso: - None
Background:
In 1836 William Williams Mather was appointed geologist of the first district, or 21 counties, of New York State. This work required seven years, and his final report was a quarto of 671 pages, with forty-six colored plates, a great undertaking for the early days of geological research. From 1837 to 1840, he also superintended the geological survey of the state of Ohio, and made elaborate reports (2 vols., Columbus, 1838). In 1838/9 he made a report upon the geological reconnaissance of the state of Kentucky.
Mather, William W. 1804 - 1859
Mather was an important American geologist and natural historian. Mather was born in Brooklyn, Connecticut to an old New England family. In 1823, as a young man, he entered the West Point military academy after which he served as a 2nd Lieutenant in the Seventh Infantry. His interest in Chemistry and mineralogy soon called him back to West Point where he acted as an Assistant Professor of Geology. After resigning from the Army in 1834 with a rank of 1st Lieutenant, Mather accepted a position as Professor of Chemistry at the University of Louisiana. Later he was employed as Professor of Natural History and Sciences at the University of Ohio, was appointed Geologist of the First Geological District of New York for Governor William H. Seward, and was the State Geologist of both Ohio and Kentucky. In 1847 Mather became president of the University of Ohio. During his long career Mather made copious notes regarding his geological explorations, published profusely, and had a lively and extensive correspondence - much of which remains accessible to this day. Mather reports on one humorous incident in Long Island where, while collecting rock specimens, he had a run-in with a local farmer. The famer, observing the care with which Mather collected and cataloged his rock specimens, assumed that Mather had, in fact, discovered gold! Mather died in Columbus, Ohio on February 26, 1859. Today the W.W. Mather Medal is an important Geologic Reserach commendation. (Collections of the Minnesota Historical Society, p. 133.)
Endicott and Company (fl. c. 1828 - 1891) was a New York based family run lithography firm that flourished throughout the 19th century. The firm was founded by George and William Endicott, brothers who were born in Canton, Massachusetts. George Endicott (June 14, 1802 - 1848) trained as a lithographer under Pendleton Lithography from January of 1826. He later worked as superintendent of Senefelder Company until the summer of 1828. Afterwards, in 1830, he relocated to Baltimore and partnered with Moses Swett. Endicott and Swett relocated to New York City in December of 1831. They remained partners until July of 1834 when the relationship dissolved. George set up shop on his own account at 359 Broadway. William Endicott (1815 - 1851), George\\\'s younger brother of 14 years, joined the firm in 1840 and was made a partner in 1845, after which the name of the firm was changed to G. and W. Endicott. George Endicott died shortly afterward, in 1848, but William continued operating the firm as William Endicott and Co. until his own 1851 death at just 35 years. The firm was carried on by his widow Sara Munroe Endicott until it was taken over by her son, Francis Endicott, who ran the firm from 1852 to 1886. George Endicott, Jr. subsequently ran the firm from 1887 to 1891. Peters, in his important work on American lithography America on Stone writes \\\"it is hard to summarize the Endicotts. They did everything and did it well . . . [they] worked with and for Currier and Ives, yet in spite of all that much of their work lacks real individuality.\\\" The Endicott firm was responsible for many 19th century views and plans of New York City and state as well as plans of Sacramento, California, and the Midwest.
1842 William Mather Antique Geology Print of Hudson River, Sullivan County, NY
Antique Map
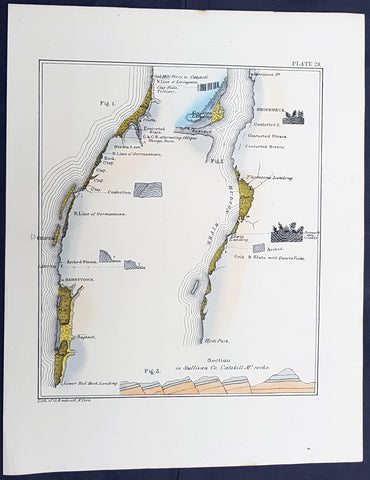
- Title : Section in Sullivan Co. Catskill Mt Rocks
- Size: 11 1/2in x 9in (280mm x 230mm)
- Condition: (A+) Fine Condition
- Date : 1842
- Ref #: 93067
Description:
This original hand coloured antique lithograph cross sectional geological map,a view along the Hudson River in Sullivan County, New York by the Endicott company, was published in the 1842 edition of William Mathers Geology of New York
Sullivan County is a county in the U.S. state of New York.
When the Province of New York established its first twelve counties in 1683, the present Sullivan County was part of Ulster County. In 1809, Sullivan County was split from Ulster County.
In the late 19th century, the Industrial Revolution and the advent of factories driven by water power along the streams and rivers led to an increase in population attracted to the jobs. Hamlets enlarged into towns. As industry restructured, many of those jobs left before the middle of the twentieth century. The economy changed again after that, shifting to a more tourist-based variety and benefiting from resorts established by European Jewish immigrants and their descendants in what became called the Borscht Belt of the 20th century. Resort hotels featured a wide variety of entertainers, some nationally known. At the beginning of this period, visitors traveled to the area by train, and later by automobile. The areas natural resources also provided a setting for numerous summer camps frequented by the children of immigrants and their descendants.
General Definitions:
Paper thickness and quality: - Heavy and stable
Paper color : - off white
Age of map color: - Original
Colors used: - Yellow
General color appearance: - Authentic
Paper size: - 11 1/2in x 9in (280mm x 230mm)
Plate size: - 11 1/2in x 9in (280mm x 230mm)
Margins: - Min 1/2in (12mm)
Imperfections:
Margins: - None
Plate area: - None
Verso: - None
Background:
In 1836 William Williams Mather was appointed geologist of the first district, or 21 counties, of New York State. This work required seven years, and his final report was a quarto of 671 pages, with forty-six colored plates, a great undertaking for the early days of geological research. From 1837 to 1840, he also superintended the geological survey of the state of Ohio, and made elaborate reports (2 vols., Columbus, 1838). In 1838/9 he made a report upon the geological reconnaissance of the state of Kentucky.
Mather, William W. 1804 - 1859
Mather was an important American geologist and natural historian. Mather was born in Brooklyn, Connecticut to an old New England family. In 1823, as a young man, he entered the West Point military academy after which he served as a 2nd Lieutenant in the Seventh Infantry. His interest in Chemistry and mineralogy soon called him back to West Point where he acted as an Assistant Professor of Geology. After resigning from the Army in 1834 with a rank of 1st Lieutenant, Mather accepted a position as Professor of Chemistry at the University of Louisiana. Later he was employed as Professor of Natural History and Sciences at the University of Ohio, was appointed Geologist of the First Geological District of New York for Governor William H. Seward, and was the State Geologist of both Ohio and Kentucky. In 1847 Mather became president of the University of Ohio. During his long career Mather made copious notes regarding his geological explorations, published profusely, and had a lively and extensive correspondence - much of which remains accessible to this day. Mather reports on one humorous incident in Long Island where, while collecting rock specimens, he had a run-in with a local farmer. The famer, observing the care with which Mather collected and cataloged his rock specimens, assumed that Mather had, in fact, discovered gold! Mather died in Columbus, Ohio on February 26, 1859. Today the W.W. Mather Medal is an important Geologic Reserach commendation. (Collections of the Minnesota Historical Society, p. 133.)
Endicott and Company (fl. c. 1828 - 1891) was a New York based family run lithography firm that flourished throughout the 19th century. The firm was founded by George and William Endicott, brothers who were born in Canton, Massachusetts. George Endicott (June 14, 1802 - 1848) trained as a lithographer under Pendleton Lithography from January of 1826. He later worked as superintendent of Senefelder Company until the summer of 1828. Afterwards, in 1830, he relocated to Baltimore and partnered with Moses Swett. Endicott and Swett relocated to New York City in December of 1831. They remained partners until July of 1834 when the relationship dissolved. George set up shop on his own account at 359 Broadway. William Endicott (1815 - 1851), George\\\'s younger brother of 14 years, joined the firm in 1840 and was made a partner in 1845, after which the name of the firm was changed to G. and W. Endicott. George Endicott died shortly afterward, in 1848, but William continued operating the firm as William Endicott and Co. until his own 1851 death at just 35 years. The firm was carried on by his widow Sara Munroe Endicott until it was taken over by her son, Francis Endicott, who ran the firm from 1852 to 1886. George Endicott, Jr. subsequently ran the firm from 1887 to 1891. Peters, in his important work on American lithography America on Stone writes \\\"it is hard to summarize the Endicotts. They did everything and did it well . . . [they] worked with and for Currier and Ives, yet in spite of all that much of their work lacks real individuality.\\\" The Endicott firm was responsible for many 19th century views and plans of New York City and state as well as plans of Sacramento, California, and the Midwest.
1842 William Mather Antique Geology Print Hudson River Lakes George to Champlain
Antique Map
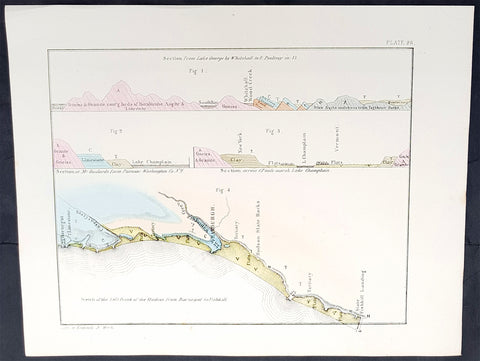
- Title : Section from Lake George by Whitehall to E Poultney in VT
- Size: 11 1/2in x 9in (280mm x 230mm)
- Condition: (A+) Fine Condition
- Date : 1842
- Ref #: 93064
Description:
This original hand coloured antique lithograph cross sectional geological map,a view along the Hudson River from Lake George in NY to Lake Champlain Vermont by the Endicott company, was published in the 1842 edition of William Mathers Geology of New York
General Definitions:
Paper thickness and quality: - Heavy and stable
Paper color : - off white
Age of map color: - Original
Colors used: - Yellow
General color appearance: - Authentic
Paper size: - 11 1/2in x 9in (280mm x 230mm)
Plate size: - 11 1/2in x 9in (280mm x 230mm)
Margins: - Min 1/2in (12mm)
Imperfections:
Margins: - None
Plate area: - None
Verso: - None
Background:
In 1836 William Williams Mather was appointed geologist of the first district, or 21 counties, of New York State. This work required seven years, and his final report was a quarto of 671 pages, with forty-six colored plates, a great undertaking for the early days of geological research. From 1837 to 1840, he also superintended the geological survey of the state of Ohio, and made elaborate reports (2 vols., Columbus, 1838). In 1838/9 he made a report upon the geological reconnaissance of the state of Kentucky.
Mather, William W. 1804 - 1859
Mather was an important American geologist and natural historian. Mather was born in Brooklyn, Connecticut to an old New England family. In 1823, as a young man, he entered the West Point military academy after which he served as a 2nd Lieutenant in the Seventh Infantry. His interest in Chemistry and mineralogy soon called him back to West Point where he acted as an Assistant Professor of Geology. After resigning from the Army in 1834 with a rank of 1st Lieutenant, Mather accepted a position as Professor of Chemistry at the University of Louisiana. Later he was employed as Professor of Natural History and Sciences at the University of Ohio, was appointed Geologist of the First Geological District of New York for Governor William H. Seward, and was the State Geologist of both Ohio and Kentucky. In 1847 Mather became president of the University of Ohio. During his long career Mather made copious notes regarding his geological explorations, published profusely, and had a lively and extensive correspondence - much of which remains accessible to this day. Mather reports on one humorous incident in Long Island where, while collecting rock specimens, he had a run-in with a local farmer. The famer, observing the care with which Mather collected and cataloged his rock specimens, assumed that Mather had, in fact, discovered gold! Mather died in Columbus, Ohio on February 26, 1859. Today the W.W. Mather Medal is an important Geologic Reserach commendation. (Collections of the Minnesota Historical Society, p. 133.)
Endicott and Company (fl. c. 1828 - 1891) was a New York based family run lithography firm that flourished throughout the 19th century. The firm was founded by George and William Endicott, brothers who were born in Canton, Massachusetts. George Endicott (June 14, 1802 - 1848) trained as a lithographer under Pendleton Lithography from January of 1826. He later worked as superintendent of Senefelder Company until the summer of 1828. Afterwards, in 1830, he relocated to Baltimore and partnered with Moses Swett. Endicott and Swett relocated to New York City in December of 1831. They remained partners until July of 1834 when the relationship dissolved. George set up shop on his own account at 359 Broadway. William Endicott (1815 - 1851), George\\\'s younger brother of 14 years, joined the firm in 1840 and was made a partner in 1845, after which the name of the firm was changed to G. and W. Endicott. George Endicott died shortly afterward, in 1848, but William continued operating the firm as William Endicott and Co. until his own 1851 death at just 35 years. The firm was carried on by his widow Sara Munroe Endicott until it was taken over by her son, Francis Endicott, who ran the firm from 1852 to 1886. George Endicott, Jr. subsequently ran the firm from 1887 to 1891. Peters, in his important work on American lithography America on Stone writes \\\"it is hard to summarize the Endicotts. They did everything and did it well . . . [they] worked with and for Currier and Ives, yet in spite of all that much of their work lacks real individuality.\\\" The Endicott firm was responsible for many 19th century views and plans of New York City and state as well as plans of Sacramento, California, and the Midwest.
1626 (1676) John Speed Antique Map of America - Beautiful Condition
Antique Map
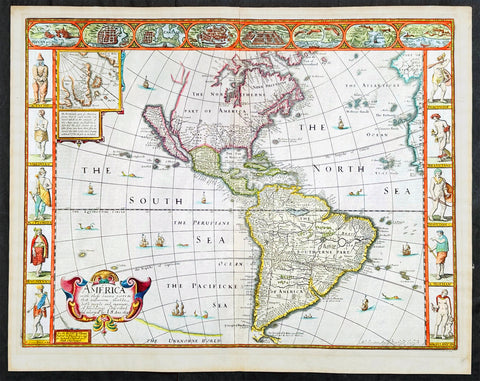
- Title : America with those known parts in that unknowne world both people and manner of buildings discribed and inlarged by I.S. Ano 1626.
- Date : 1626 (1676)
- Size: 21 1/2in x 17in (545mm x 430mm)
- Condition: (A+) Fine Condition
- Ref: 35654
Description:
This original hand coloured copper plate engraved antique map of America by John Speed was published in the 1676 Bassett & Chiswell edition of Speeds famous atlas Prospect of the Most Famous Parts of the World.
One of the best examples of this map I have seen. Beautiful original condition with original hand colour, clean heavy impression on sturdy clean paper with original margins, which is very rare.
This 1626 map of America is the fourth or 1676 state and is one of the most iconic maps of America, surrounded by decorative vignettes illustrating the indigenous peoples and cities of the Americas. This map is both beautiful and important. It features a number of first, including being the first atlas map to depict California as an island and to accurately depict the east coast of North America. Cartographically it follows on the earlier maps of the Dutchman Abraham Goos, the engraver, with updates to reflect the 1625 Briggs vision of an insular California
General Definitions:
Paper thickness and quality: - Heavy and stable
Paper color : - off white
Age of map color: - Original
Colors used: - Yellow, green, blue, pink
General color appearance: - Authentic
Paper size: - 21 1/2in x 17in (545mm x 430mm)
Plate size: - 20 1/4in x 15 1/2in (515mm x 395mm)
Margins: - Min 3/4in (20mm)
Imperfections:
Margins: - None
Plate area: - None
Verso: - Old archival hinge paper top of verso, not affecting the map.
Background:
This is the first atlas map to represent California as an island. The idea of an insular California first appeared as a work of fiction in Garci Rodriguez de Montalvo's c. 1510 romance Las Sergas de Esplandian, where he writes
.....Know, that on the right hand of the Indies there is an island called California very close to the side of the Terrestrial Paradise; and it is peopled by black women, without any man among them, for they live in the manner of Amazons.....
Baja California was subsequently discovered in 1533 by Fortun Ximenez, who had been sent to the area by Hernan Cortez. When Cortez himself traveled to Baja, he must have had Montalvo's novel in mind, for he immediately claimed the 'Island of California' for the Spanish King. By the late 16th and early 17th century ample evidence had been amassed, through explorations of the region by Francisco de Ulloa, Hernando de Alarcon and others, that California was in fact a peninsula. However, by this time other factors were in play. Francis Drake had sailed north and claimed 'New Albion' (identified here on the northwest coast of California Island) near modern day Washington or Vancouver for England. The Spanish thus needed to promote Cortez's claim on the 'Island of California' to preempt English claims on the western coast of North America. Henry Briggs, an English mathematician, began promoting the idea of an insular California in 1622, citing the journals of Friar Antonio de la Ascension, who accompanied the 1602-03 Sebastian Vizcaino expedition. The significant influence of the Spanish crown on European cartographers caused a major resurgence of the Insular California theory. Just before this map was made Eusebio Kino, a Jesuit missionary, traveled overland from Mexico to California, proving conclusively the peninsularity of California. Even so, it was ultimately a 1747 royal decree from King Ferdinand VII of Spain that finally forced cartographers to give up on the alluring idea.
Other elements of interest in North America are the complete absence of the Great Lakes - which in 1626 had yet to be conceived of by any European cartographers. The Straits of Anian appear tenuously in the extreme northwest, just above California. Just east of the 'o' in 'California', on the continental mainland, there is a curious ghosted in lake called the 'Lagueo de Oro.' We have found no references or explanation for this. None of the legendary kingdoms of gold, Quivara, Teguayo, Cibola, etc. are noted. The western portions of the Hudson Bay are unmapped - suggestive of their unexplored status. The addition of Long Island and Boston, in notably darker print, are important updates over the earliest editions.
South America offers much of interest including the mythical Lake Parimia, in Guiana. The legend of Parima is associated with the English adventurer Sir Walter Raleigh's search for El Dorado. Believing El Dorado to lie in the northern part of the Amazon, Raleigh sailed down the Orinoco River just before the onset of the rainy season. Reaching a remote tribal village, Raleigh noted canoes arriving bearing gold, silver, and other treasures. Asked where the gold came from, the natives replied, 'Manoa', the term for the tribe to which the river traders belonged. Manoa, the natives claimed could be reached following a long river voyage southward to a Great Lake, called Parima. Raleigh and his associates immediately associated Manoa and Lake Parima with the golden kingdom of El Dorado, though they never visited the city or lake. Subsequent maps, including this one, mapped el Dorado and Lake Parima in this location for several hundred years. Both Raleigh and the natives were describing an actual event known to occur annually in the region. Rains would annually swell the Amazon and Orinoco river systems creating a linkage in the Rupununu flood plain, which, during heavy rains, can resemble a massive lake. The Manoa were a large and populous trading nation active in pre-colonial days whose vast empire, based in the Amazon Basin, extended form the Andes to the Orinoco. Curiously, in addition to noting the city of Manoa on Lake Parima, D'Anville also correctly maps the center of the ancient Manoan civilization between the Amazon tributaries Rio Negro and Rio Yapura. Sadly the Manoa and many of the other populous South American indigenous nations noted by the earliest explores to the region vanished, brought low by European epidemics.
Another mythical lake, Eupana, appears further south connecting the Rio de la Plata and the Paraguay River to the R. Real, thus turning eastern Brazil into an island. This is a update over many earlier maps which connected Eupana directly to the Amazon. Far in the south Speed presents us ith another anomaly, the Straits of Le Maire, which separates Tierra de Fuego from another mysterious stretch of land labeled 'States Land.' The is in fact the modern island of Isla de los Estados, the southeastern most point in South America. Jacob le Maire and his pilot Willem Schouten passed to between this island and Tierra del Fuego on their 1615 voyage around Cape Horn and into the Pacific.
In the high Arctic, near Iceland and Greenland, the supposed islands of Frisland and Brasil are noted. Frisland is little more than a double mapping of Iceland. Brasil, also known as Hy-Brasil, is a phantom island north Atlantic just west of Ireland. In Irish myths it was said to be cloaked in mist, except for one day every seven years, when it became visible but still could not be reached. Little is known of this origins of this myth, but it appears on maps in various forms from about 1325. The last known appearance was in 1865 when it appeared on a nautical chart as 'Brasil Rock.' Some speculate that it may be an early reference to Porcupine Bank, a shoal in the Atlantic Ocean about 200 kilometres (120 mi) west of Ireland.
Speed's map of America is especially noteworthy for its surrounded vignettes. To either side of the map proper there are various vignettes illustrating the indigenous peoples of the America. These includes natives of Greenland, Virginia, Florida, Mexico, New England, Peru, Brazil, and Tierra del Feugo.n Along the top of the map there are eight city views: Havanna, Santo Domingo, Cartagena, Mexico City, Cuzco, the isle of Moca, Rio de Janeiro, and Olinda.
This map was engraved for John Speed by Abraham Goos. It is the fourth state of the map issued by Thomas Bassett of Fleet Street and Richard Chiswell of St. Paul's Churchyard. Bassett, Chiswell, and others continued to republish Speed's work well after his death. (Ref: Tooley, Koeman, Burden)
Please note all items auctioned are genuine, we do not sell reproductions. A Certificate of Authenticity (COA) can be issued on request.
1865 James Wyld Large Antique Folding American Civil War Map - Extremely Rare
Antique Map
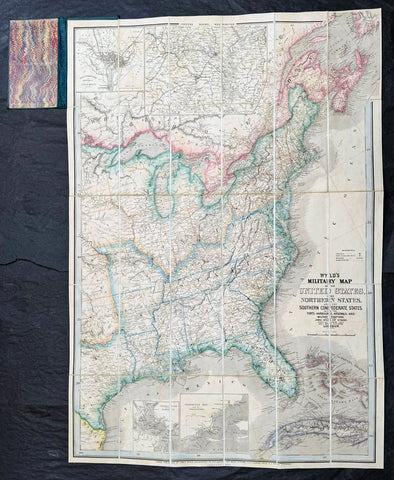
- Title : Wyld's Military Map Of The United States, The Northern States, And The Southern Confederate States: With The Forts, Harbours, Arsenals And Military Positions. James Wyld, 457 Strand; Charing Cross East And 2, Royal Exchange London. ......London, Published By James Wyld, Geographer To The Queen
- Date : 1865
- Size: 34 1/2in x 24in (875mm x 610mm)
- Condition: (A+) Fine Condition
- Ref: 35660
Description:
A very rare map of the United States first issued in 1861, during the Secession Crises that preceded the outbreak of the American Civil War, with this rare edition issued in January 1865 - dated at the foot of the map, only 4 months before the end of the war..
There are a few 1861 editions of this map for sale, currently on the market, but I have been unable to find an 1865 edition, either currently on the market or sold in the past.
General Definitions:
Paper thickness and quality: - Heavy and stable
Paper color : - off white
Age of map color: - Original
Colors used: - Yellow, green, blue, pink
General color appearance: - Authentic
Paper size: - 34 1/2in x 24in (875mm x 610mm)
Plate size: - 34 1/2in x 24in (875mm x 610mm)
Margins: - Min 1/2in (12mm)
Imperfections:
Margins: - None
Plate area: - None
Verso: - None
Background:
Wyld was particularly masterful at capturing political events throughout the world as they happened and leveraging his impressive publishing operation to quickly produce and distribute pertinent to the invested public. In this case, the map distinguishes between the 'Northern States' (orange border) and the 'Southern Confederate States' (blue border). Wyld here erroneously conflates slaveholding states with Confederate secessionist states - in particular, Missouri, Kentucky, Delaware, and Maryland, which allowed slavery but remained loyal to the Union. Arsenals, forts, and military posts highlighted and keyed, underscoring that 'war' was very much in the air. The map is also noteworthy for recognizes the apocryphal territory 'Chippewa', roughly corresponding to modern-day North Dakota.
This map is scarce to the market. Known institutions holdings at the Boston Public Library, the Library of Congress, Bibliothèque nationale de France, the David Rumsey Collection, among others. (Ref: M&B; Tooley; Clancy) (Ref: Tooley, Koeman, Burden)
Please note all items auctioned are genuine, we do not sell reproductions. A Certificate of Authenticity (COA) can be issued on request.
1642 Blaeu, Hondius & John Smith Antique Map of Virginia, America - Pocahontas
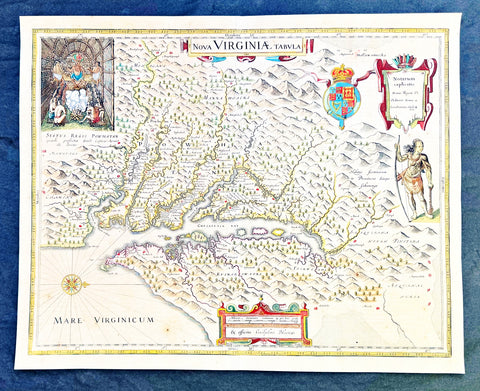
- Title : Nova Virginiae Tabula
- Date : 1642
- Condition: (A+) Fine Condition
- Ref: 35667
- Size: 20in x 16in (510mm x 410mm)
Description:
This superb original antique hand coloured map of Chesapeake Bay, Virginia was published in the 1642 Dutch edition of Mercators Atlas.
This map by Blaeu comes directly from John Smiths map of Virginia. Blaeu bought this plate from Joducus Hondius who had engraved it directly from John Smith map. It is the only map on the market that is unchanged from Smiths map.
Although this map bears the name of Willem Blaeu, it comes from the plate stock of the Amsterdam publisher Jodocus Hondius the younger in 1629. Blaeu then issued the map in his Atlantis Appendix and in most editions of the firms atlases thereafter.
The map is a version of the map by the Englishman Captain John Smith in 1612. His map was the first to depict with reasonable accuracy Chesapeake Bay with its tributaries and became the accepted prototype map for most subsequent maps of the colony published either in Britain or Europe during the remainder of the 17th century.
Captain Smiths maps acted as a promotional piece for the vast area of North America called Virginia and it exerted a great influence of the history of English colonisation in America.
John Smith (1579-1631) was the foremost English settler in Virginia. His many adventures included being captured several times, defeating an Indian chief in hand to hand combat as well as the celebrated incident in which Pocahontas saved him from Powhatan who is himself the subject of the portrait at the upper left hand corner of Blaeus map.
While the geographical detail of the map shows information accurate at the time of Smiths travels, earlier descriptions of Virginia are recalled. When Smiths map appeared in 1612, the engraver turned to an engraving by the German Theodor de Bry based on the drawings made by John White in the 1580s for the portrait of Powhatan, and the figure of an Indian in war paint at the right to represent the Susquehanna chief. All of these elements were combined by the Amsterdam engraver Dirk Grijp for the Dutch version of Smiths map as issued by the Hondius firm in 1618. Thus, when Blaeu purchased the plate it was already a decade old and it was issued unchanged except for his imprint and a few very small retouches until the 1660s. The Blaeu derivative was the most popular version of Captain Smith Map published during the seventeenth century.
General Definitions:
Paper thickness and quality: - Heavy and stable
Paper color : - off white
Age of map color: - Original
Colors used: - Yellow, green, blue, pink
General color appearance: - Authentic
Paper size: - 20in x 16in (510mm x 410mm)
Plate size: - 19in x 15in (495mm x 390mm)
Margins: - Min 1/2in (12mm)
Imperfections:
Margins: - Light age toning
Plate area: - Light age toning, light crease along centerfold
Verso: - None
Background:
This is one of the most important seventeenth century maps of the Chesapeake Bay region. The early settlement of Jamestown Iamestowne is noted along with a number of other place names, both in English and Native American. The map was derived from Capt. John Smith\'s map of 1612 and was the first to depict the bay and its tributaries with any accuracy.
Capt John Smith's fine survey work, as well as reports from indigenous American Indian tribes, and fanciful wishful thinking, combine to make this one of the most interesting maps of America to emerge in the 17th century. Philip D. Burden, the author of The Mapping of America, considers this map, Nova Virginiae Tabula, to be \'one of the most important maps of America ever produced and certainly one of the greatest influence.\' Oriented to the west, this map covers from Cape Henry to the Susquehanna River and inland as far as the Appellation Mountains. The Chesapeake Bay is shown in full as are many of its river estuaries, though topographically this map places a number of mountain ranges where there are in fact none.
To fully understand this map one must first realize that most Europeans believed the Pacific, or at least some great bay that led to the Pacific, lay just a few days travel inland. In the minds of most Europeans of the period, the trade potential for the Virginia colony was entirely dependent upon it being a practical access point to the riches of Asia. Thus the significance of large and mysterious body of water appearing in the land of the Massawomecks, in the upper right quadrant, becomes apparent. Of course, much of this land was entirely unexplored by the European settlers in Jamestown, shown here on the Powhatan River (James River), who relied heavily upon American Indian reports for much of their cartographic knowledge of the Virginia hinterlands. The Massawomecks themselves were a rival of the Powhatan and made their home near the headwaters of the Potomac. These, like many other indigenous groups of the region made only a brief and frequently violent appearance during the 17th century before entirely disappearing, mostly from disease and war, in the early 18th century.
In the upper left quadrant there is an image of the American Indian chief of the Powhatan sitting enthroned before a great fire in his long house. One of the more popular legends regarding John Smith was his capture and trial before the chief of the Powahatan. Smith was convinced that his liberation had something to do with the youthful daughter of Chief Powahatan, Pocahontas, taking a liking to him. Although this grew into a fictitious legend of its own, the truth is more likely that Powhatan saw Smith and his Englishmen as potential allies against the rival American Indian groups, such as the Massawomecks, that were pressing hard against his borders.
There are a number of different editions of this map and its publication by various map houses in various states made it the first widely distributed map of the Virginia colony and of John Smith\'s important map. There was, however, a scandal relating to its publication. The map was originally drawn and engraved in 1618 by Jodocus Hondius based upon the first edition of John Smith\'s 1612 map. When Jodocus died in 1629, he and his brother, Henricus Hondius, while collaborating on the Hondius Atlas Major, had established and maintained separate business for some 10 years. Jodocus\' death enabled the competing cartographer, Willem Blaeu to acquire a large number of Jodocus\' map plates, which he promptly published in 1630 as the Atlantis Appendix. Henricus, in the meantime, had been counting on Jodocus\' new plates to enhance his own, by then outdated, Hondius Atlas Major. A surviving contract dated March 2, 1630 reveals that Henricus Hondius and his partner Joannes Janssonius hired engravers to produce a number of new map plates copying the work of Jodocus – now in the hands of the Blaeu firm. This map was among the most important of that group and accounts for variants of this map being issued by competing Blaeu and Hondius firms.
The History of Virginia begins with documentation by the first Spanish explorers to reach the area in the 1500s, when it was occupied chiefly by Algonquian, Iroquoian, and Siouan peoples. After a failed English attempt to settle Virginia in the 1580s by Walter Raleigh permanent English settlement began in Virginia with Jamestown, Virginia, in 1607. The Virginia Company colony was looking for gold but failed and the colonists could barely feed themselves. The famine during the harsh winter of 1609 forced the colonists to eat leather from their clothes and boots and resort to cannibalism.[1] The colony nearly failed until tobacco emerged as a profitable export. It was grown on plantations, using primarily indentured servants for the intensive hand labor involved. After 1662, the colony turned black slavery into a hereditary racial caste. By 1750, the primary cultivators of the cash crop were West African slaves. While the plantations thrived because of the high demand for tobacco, most white settlers raised their families on subsistence farms. Warfare with the Virginia Indian nations had been a factor in the 17th century; after 1700 there was continued conflict with natives east of the Alleghenies, especially in the French and Indian War (1754-1763), when the tribes were allied with the French. The westernmost counties including Wise and Washington only became safe with the death of Bob Benge in 1794.
The Virginia Colony became the wealthiest and most populated British colony in North America, with an elected General Assembly. The colony was dominated by rich planters who were also in control of the established Anglican Church. Baptistand Methodist preachers brought the Great Awakening, welcoming black members and leading to many evangelical and racially integrated churches. Virginia planters had a major role in gaining independence and in the development of democratic-republican ideals of the United States. They were important in the Declaration of Independence, writing the Constitutional Convention (and preserving protection for the slave trade), and establishing the Bill of Rights. The state of Kentucky separated from Virginia in 1792. Four of the first five presidents were Virginians: George Washington, the "Father of his country"; and after 1800, "The Virginia Dynasty" of presidents for 24 years: Thomas Jefferson, James Madison, and James Monroe.
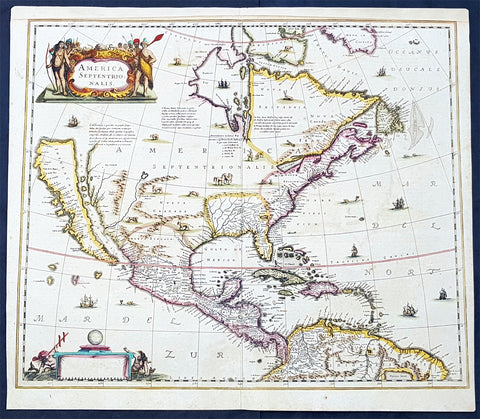
1639 Henricus Hondius Antique 1st Edition Map of North America California Island
Antique Map
- Title : America Septentrionalis
- Date : 1639
- Condition: (A+) Fine Condition
- Ref: 43161-1
- Size: 23in x 20in (595mm x 510mm)
Description:
This magnificent original copper-plate engraved antique rare 1st state map of North America, with California as an Island, by Henricus Hondius was published in the 1639 French edition.
There were only 3 publications of this map by Hondius in the 1630s & 40s with Jan Jansson replacing the map with his signature in 1641.
The now seldom seen first state of an important, early Dutch map of North America. It one of the first Dutch atlas maps to show California as an island, preceded only by the Hondius Hondius world map of 1633. A note on the map recounting the story of the origin of the California-as-an-island refers to a Dutch captain who obtained a map of California depicted as an island from a captured Spanish ship. The note even provides the dimensions of the island. The Hondius map was an important conduit for bringing the island myth into the cartographic mainstream. Further, Tooley noted the map was also first attempt in Holland to add lakes connected to the St. Lawrence. One of these lakes on the map is in the approximate shape and position of Lake Ontario.
This was also one of a very few, early Dutch maps specifically of North America (as opposed to the entire Western Hemisphere). Aside from the rare De Jode map of 1593, this is the only folio-sized map of North America produced during the entire Dutch Golden Age.
General Definitions:
Paper thickness and quality: - Light and stable
Paper color : - off white
Age of map color: - Original
Colors used: - Blue, pink, red, green, yellow
General color appearance: - Authentic
Paper size: - 23in x 20in (595mm x 510mm)
Plate size: - 22in x 19in (500mm x 470mm)
Margins: - Min 1/2in (12mm)
Imperfections:
Margins: - Top margin extended from plate-mark
Plate area: - None
Verso: - None
Background:
Henricus Hondius beautifully engraved map of North America had significant influence in perpetuating the theory of California as an island. This was of the influence of his powerful Dutch publishing house with no earlier maps representing California as an island maps having such a wide audience. The 1630s were a decade of constant development in the houses of Blaeu, Hondius & Jansson. It is interesting to note that Blaeu never produced a single sheet map of North America; producing a map of just the whole American continent, first produced in 1617. Also during this decade Joannes Janssonius became an active partner of Hondius, and although this map does not bear his mark, it is believe it was his creation, based on the very similar South American, at the same time, displaying his name.
Cartographically this map is a careful composition of many different sources. The depiction and nomenclature of the west, along with that of California, derive directly from the Henry Briggs The North Part of America, 1625. A legend placed strategically over the north-west coastline offers the opportunity to discontinue a coastline least understood. An unnamed lake still feeds a Rio del Norto flowing incorrectly south-west into what should be the headwaters of the Gulf of California. On the east bank of this river is Real de Nueua Mexico, or Santa Fe. The Gulf of Mexico and the Florida peninsula originate from the Hessel Gerritsz chart of c.1631.
The east coast, however, is harder to define; the south-east appears to be quite generic in form. It is the area north of here that does not appear to be from a particular source. The Chesapeake Bay area is defined in about as much detail as the scale and style of the map will allow, Iames Towne being clearly identified. NOVUM BELGIUM is unlike any other before it, the area between the Zuitt Reuier (Delaware River) and the Noort R (Hudson River) being greatly elongated on a north-east to south-west axis. New Amsterdam is curiously not designated although Fort Orange is present. For New England just a select few names have been chosen from John Smiths map of the area, 1616. The Gulf of St. Lawrence appears to follow de Laet more than Champlain. The latter is used to depict a single great Lake; however, its name, Lac des Iroquois, is borrowed from one nearby. Interestingly the author chose not use Champlains more recent 1632 map but the earlier 1612 Carte Geographique De La Nouvelle France; To avoid unknown territory he does not venture the river system further west, unlike Champlain. Along the Atlantic coast of Labrador we find for the first time much Dutch Nomenclature, reflecting their increased whaling activities in these waters. Hudson Bay is clearly derived from Briggs, 1625, except for the west coast where he introduces the cartography of Thomas James, 1633. The addition of a fox here could be seen as a veiled reference to Luke Foxe, whose own map of the previous year bears just such an animal.
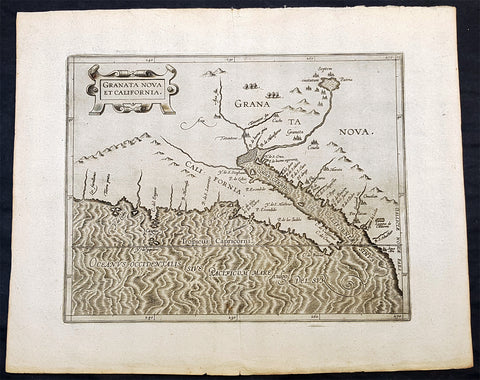
1597 Cornelis Wytfliet Antique Map Early Important Map of California & SW America
Antique Map
- Title : Granata Nova et California
- Size: 15in x 12in (380mm x 305mm)
- Condition: (A+) Fine Condition
- Date : 1597
- Ref #: 41716
Description:
A fine original antique, and incredibly important map the first to focus on California & the SW was published by Cornelis van Wytfliet in the 1597 edition of Descriptionis Ptolemaicae Augmentum.
The first printed map devoted to California and the south-west of the present day United States. One of the most interesting features is the depiction of so many fabled places largely from Spanish sources. Most notable amongst these are the seven cities of Cibola. The seven cities originated from the narrative of Fray Marcos de Niza in 1539. Some of the other nomenclature originates from Coronados epic exploration. The outline map is fairly accurate and is derived largely from Petrus Plancius large world map of 1592. The main coastal irregularity is the westward slant of the Californian coastline. Bearing in mind that it would be shown as part of an island in twenty five years, this is quite forgivable. No other states of the map are known and all issues are without text on the back (Burden 106).
General Definitions:
Paper thickness and quality: - Heavy and stable
Paper color : - off white
Age of map color: -
Colors used: -
General color appearance: -
Paper size: - 15in x 12in (380mm x 305mm)
Plate size: - 11 1/4in x 9 1/4in (285mm x 235mm)
Margins: - Min 1in (25mm)
Imperfections:
Margins: - None
Plate area: - None
Verso: - None
Background:
In 1597 Cornelis van Wytfliet published his Augmentum to Ptolemys Geography. Dedicated to Philip III of Spain it is a history of the New World to date, recording its discovery, natural history etc. For the book Wytfliet had engraved nineteen maps, by whom we do not know, one of the world and eighteen regional maps of the Americas. As such this book can be truly called the first atlas of the New World, America.
Wytfliet, Cornelis van d. 1597
Cornelius Wytfliet or Cornelis van Wytfliet was a geographer from Leuven in the Habsburg Netherlands, best known for producing the first atlas of the Americas.
Cornelius was the son of Catherine Huybrechts and her husband, Gregorius Wytfliet, who was advocate fiscal of Leuven University from 1557 to 1594. After graduating Licentiate in Laws from the University of Leuven, Wytfliet moved to Brussels and became secretary to the Council of Brabant. He died in or shortly after 1597, when his Descriptionis Ptolemaicae Augmentum (a work adding new discoveries to Ptolemys description of the world) was published
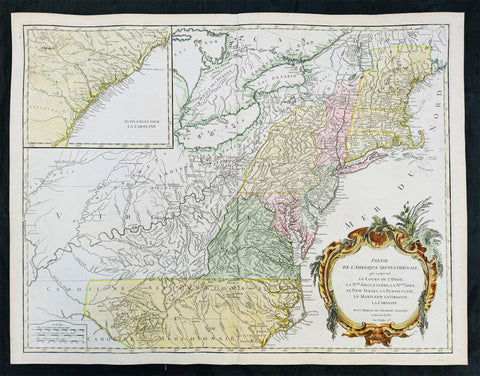
1755 (1768) Robert De Vaugondy Large Antique 2nd edition Map of Colonial United States
Antique Map
- Title : Partie De L Amerique Septentrionale, qui Comprend Le Cours De L Ohio...Par le Sr Robert de Vaugondy
- Date : 1755 (1768)
- Condition: (A+) Fine Condition
- Ref: 93514
- Size: 26in x 20 1/2in (660mm x 520mm)
Description:
This large original beautifully hand coloured, scarce 2nd edition antique map of the east coast of the United States, illustrating the course of the Ohio River and stretching from New England to the Carolinas, north to the Great Lakes and south to the Mississippi - with an inset map of The Carolinas - was published in 1768 - dated 1755 in the cartouche - by Robert Du Vaugondy in his Atlas Universal.
This map is all original with hand colour on age toned heavy paper with original margins with a heavy dark ink denoting an early pressing.
General Definitions:
Paper thickness and quality: - Heavy and stable
Paper color : - off white
Age of map color: - Original & later
Colors used: - Yellow, green, blue, pink
General color appearance: - Authentic
Paper size: - 26in x 20 1/2in (660mm x 520mm)
Plate size: - 25in x 19 1/2in (635mm x 495mm)
Margins: - Min 1/2in (12mm)
Imperfections:
Margins: - Light age toning in margins
Plate area: - None
Verso: - None
Background:
Second state of the early de Vaugondy map of the British colonies, with changes after the 1763 Treaty of Paris, with Virginia & Carolina extended to the Mississippi and Pennsylvania extended to Lake Erie. The majority of geographical information is based upon John Mitchells great map of North America from the mid 1750s, also drawing from Lewis, Evans on the Middle British Colonies and Joshua Frys and Peter Jeffersons map of Virginia and Maryland. The Mitchell map was the culmination of many years of British surveying in the North American Colonies and was considered one of the best maps of the continent available to Europeans and Americans in the mid-eighteenth century.
De Vaugondys rendition does not copy the full scope of Mitchells map but instead focuses on the colonies stretching from southern Maine to the Carolinas. In the top left corner is an inset of South Carolina and Georgia. De Vaugondy also pays special attention to the river systems and settlements. This map shows some of the earliest accurate information of the trans-Allegheny regions (the Ohio River, Kentucky, Tennessee and Parts of Ohio) and inland areas to the southeast of the Great Lakes and interior of New England.
Maine is still part of the Massachusetts Bay Colony. During this era. The dispute between New Hampshire and New York over who controlled the area which is now Vermont has been resolved. The outbreak of the French & Indian War (Seven Years War) briefly suspended interest in the disputed area, and it was not until 1764 that the British crown upheld New Yorks claim to Vermont. Included is a beautiful title cartouche in the Rococo style. (Ref: Tooley; M&B)
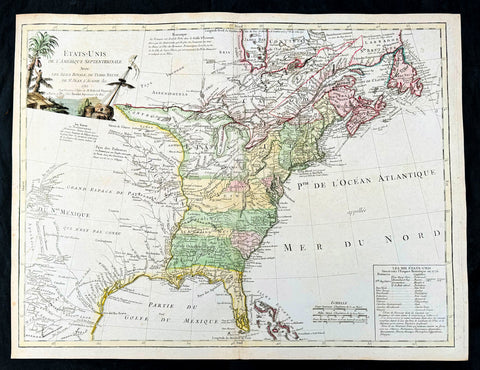
1785 De Vaugondy & Jefferson Antique Early Map of The United States of America
- Title : Etats-Unis de l'Amerique Septentrionale avec les Isles Royale, de Terre Neuve de St. Jean, l'Acadie &c. 1785 M. Robert de Vaugondy....Boudet....
- Date : 1785
- Condition: (A+) Fine Condition
- Ref: 93513
- Size: 26in x 20 1/2in (660mm x 520mm)
Description:
This large original hand coloured copper-plate engraved very important, early & scarce antique early map of the United States (Etats-Unis De L Amerique), during what is know as the Confederation Period, by Robert De Vaugondy was published by the French printer Antoine Boudet (1715 - 1787) for the supplement of de Vaugondys Atlas Universal
This scarce first state map is very important to the formation of the United States of America. The map is the first to describe what is know as the Jeffersonian Ordinance, showing the new international borders of the fledgling United States, the inclusion of the original 13 states in the bottom right text box (the first map to do so) along with the inclusion of Michigan, ratified under the Treaty of Paris in 1783.
The successor to De Vaugondy, Charles Francois Delamarche (1740 - 1817) was a known correspondent to Thomas Jefferson and along with the printer Boudet would have played an important part in the publication of this map. The Ordinance of 1784 was a plan to outline the new territories and states, that would eventually make up the foundation of the United States, ratified by the Treaty of Paris. Given that this map was engraved in 1785 or possibly earlier and that Delamarche was a friend of Jefferson, it is not a stretch to believe that he was one of the first, if not the first, to map the new country of the United States (Etats-Unis De L Amerique)
General Definitions:
Paper thickness and quality: - Heavy and stable
Paper color : - off white
Age of map color: - Original
Colors used: - Yellow, green, blue, pink
General color appearance: - Authentic
Paper size: - 26 1/2in x 20 1/2in (670mm x 520mm)
Plate size: - 25 1/2in x 19 1/2in (650mm x 500mm)
Margins: - Min 1/2in (12mm)
Imperfections:
Margins: - Light age toning in margins
Plate area: - Light creasing along centerfold
Verso: - None
Background:
The Confederation Period was the era of United States history in the 1780s after the American Revolution and prior to the ratification of the United States Constitution. In 1781, the United States ratified the Articles of Confederation and prevailed in the Battle of Yorktown, the last major land battle between British and American forces in the American Revolutionary War. American independence was confirmed with the 1783 signing of the Treaty of Paris. The fledgling United States faced several challenges, many of which stemmed from the lack of a strong national government and unified political culture. The period ended in 1789 following the ratification of the United States Constitution, which established a new, more powerful, national government.
The Articles of Confederation established a loose confederation of states with a weak federal government. An assembly of delegates acted on behalf of the states they represented. This unicameral body, officially referred to as the United States in Congress Assembled, had little authority, and could not accomplish anything independent of the states. It had no chief executive, and no court system. Congress lacked the power to levy taxes, regulate foreign or interstate commerce, or effectively negotiate with foreign powers. The weakness of Congress proved self-reinforcing, as the leading political figures of the day served in state governments or foreign posts. The failure of the national government to handle the challenges facing the United States led to calls for reform and frequent talk of secession.
The Treaty of Paris left the United States with a vast territory spanning from the Atlantic Ocean to the Mississippi River. Settlement of the trans-Appalachian territories proved difficult, in part due to the resistance of Native Americans and the neighboring foreign powers of Great Britain and Spain. The British refused to evacuate US territory, while the Spanish used their control of the Mississippi River to stymie Western settlement. In 1787, Congress passed the Northwest Ordinance, which set an important precedent by establishing the first organized territory under the control of the national government.
After Congressional efforts to amend the Articles failed, numerous national leaders met in Philadelphia in 1787 to establish a new constitution. The new constitution was ratified in 1788, and the new federal government began meeting in 1789, marking the end of the Confederation Period. Some historians believe that the 1780s were a bleak, terrible time for the US, while others have argued that the period was actually stable and relatively prosperous.
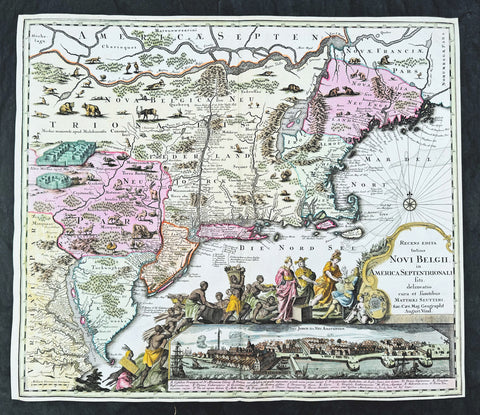
1730 Georg Seutter Antique Map of New England & New York City - Rare 2nd State
Antique Map
- Title : Recens edita totius Novi Belgii, in America Septentrionali siti, delineatio cura et sumtibus Matthaei Seutteri, Sac. Caes Maj. Geographf. August. Vind
- Size: 23in x 20 1/4in (585mm x 515mm)
- Condition: (A) Very Good Condition
- Date : 1730
- Ref #: 43001
Description:
This large beautifully hand coloured original antique map of the NE region of colonial North America, with the famous Restitutio inset birds-eye view of 17th century New York city, was engraved & published by Georg Mattraus Seutter in 1730.
This is the rare second state, identified by the omission of Chalcographi Augustani from the title and the blank shaded are directly below the title (text was added to the shaded area in the 3rd to 6th states) The cartouche and city view are uncoloured as was intended by Seutter along with the beautiful original map colouring.
This map is in exceptional condition with beautiful original colour, with heavy engraving (denoting an early pressing) on clean heavy sturdy paper. The top and left borders have been professionally extended, with no impact on the image.
There are, at the time of listing, nine of these maps for sale online, of states 2 to 6. Of the 9 only 2 are of the rare 2nd state. The average asking price of the nine maps is $4897US.
General Definitions:
Paper thickness and quality: - Heavy and stable
Paper color : - off white
Age of map color: - Original
Colors used: - Blue, pink, red, green, yellow
General color appearance: - Authentic
Paper size: - 23in x 20 1/4in (585mm x 515mm)
Plate size: - 23in x 20 1/4in (585mm x 515mm)
Margins: - Min 1/4in (5mm)
Imperfections:
Margins: - T, R & L margins extended
Plate area: - None
Verso: - None
Background:
The map is based upon the Jansson-Visscher New England series of maps, first published by Visscher in 1651. Seutter replaces the original Restitutio view of New York City with a new view of New York entitled Neu Jorck sive Neu Amsterdam, with a key to the view below in Latin. Above the view is an elaborate scene depicting natives, slaves & allegorical deities presenting tributes to the English monarch, George II. The course of the Delaware and Hudson are separated, unlike early editions of the map.
This is the first map in the series to show distinct drawn boundaries between Massachusetts, New England, New York, New Jersey and Pennsylvania, as earlier examples had previously left the delineation of the boundaries to the colorist. Philadelphia is now shown as a set of houses in relief, rather than a ground plan. The map is richly embellished with many animals and other decorations and is without doubt, one of the most decorative 18th century maps of the region.
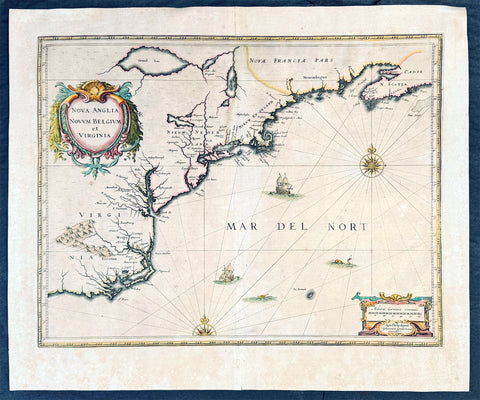
1639 Jan Jansson Antique Map of North America Virginia to New York to New England
Antique Map
- Title : Nova Anglia Novvm Belgium et Virginia
- Date : 1639
- Condition: (A+) Fine Condition
- Ref: 93508
- Size: 23in x 19in (585mm x 485mm)
Description:
This magnificent original copper plate engraved antique landmark 1st edition map of the NE region of North America, the original colonial states from Virginia to New England, was published in the 1639 French edition of Mercators Atlas
A magnificent early map of NE North America published only 19 years after the landing of the Pilgrims at Plymouth Rock, Massachusetts.
General Definitions:
Paper thickness and quality: - Heavy and stable
Paper color : - off white
Age of map color: - Original
Colors used: - Blue, pink, red, green, yellow
General color appearance: - Authentic
Paper size: - 23in x 19in (585mm x 485mm)
Plate size: - 20in x 15 1/4in (505mm x 384mm)
Margins: - Min 1in (25mm)
Imperfections:
Margins: - None
Plate area: - None
Verso: - Age toning, old archival tape on verso
Background:
This influential map is derived from the less well circulated Johannes de Laet map of 1630. Enlarged and expanded to the north and slightly east, it carries de Laets narrative on the reverse. De Laets map is one of extreme importance, being the first printed to use the names Manbattes (Manhattan) and N. Amsterdam. The nomenclature is virtually identical, with the few minor differences most likely owing to the engravers error. C of Feare is still depicted over 2° too far south. This is not Cape Fear we know of today but actually Cape lookout.
During the fiercely competitive decade of the 1630s the families of Blaeu and Hondius - Jansson of ten produced maps drawn directly from one another. Here, however, Jansson produces one that was not followed by Blaeu, the latter relying upon the more restricted map of Nova Belgica to represent the land north of Chesapeake Bay. A sign of the Dutch influence here is that both atlas producers largely declined to include the advanced cartography of Champlain, thereby relegating it altogether.
There are three know states of this map, this one first published in 1636, the second edition was published in 1647 renamed Nova Belgica Et Anglia Nova within a new square cartouche. State 3 was published in 1694 by Schenk & Valk which included new regional demarcation and a latitude and longitude grid. (Ref: Koeman; M&B; Tooley; Burden)
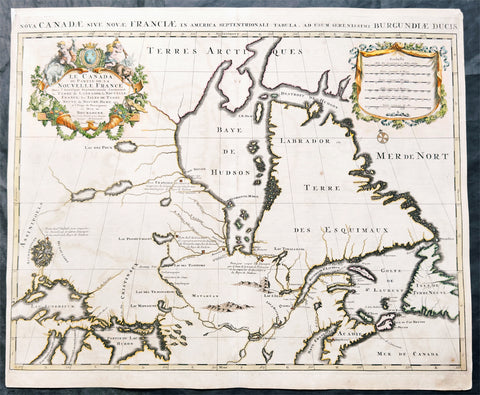
1696 Alexis Hubert Jaillot Large Antique Map North America, Canada & Great Lakes
Antique Map
- Title : Le Canada ou Partie de la Nouvelle France....Hubert Jaillot....1696
- Size: 24 3/4in x 20 1/2in (680mm x 520mm)
- Condition: (A) Very Good Condition
- Date : 1696
- Ref #: 51014
Description:
This large original copper plate engraved, hand coloured antique map of North America, Canada and the Great Lakes was engraved in 1696 - dated in title - and was published by Alexis Hubert Jaillot in his monumental Atlas Nouveau.
General Definitions:
Paper thickness and quality: - Heavy and stable
Paper color : - off white
Age of map color: - Original
Colors used: - Yellow, green, blue, pink
General color appearance: - Authentic
Paper size: - 35 1/2in x 23in (900mm x 585mm)
Plate size: - 34 1/2in x 22 1/2in (875mm x 570mm)
Margins: - Min 1/2in (15mm)
Imperfections:
Margins: - Light age toning in margin
Plate area: - Light age toning and offsetting
Verso: - 4 small re-enforcements on verso
Background:
Nice example of Jaillot's map of Hudson's Bay, Canada, the Great Lakes, and the regions then controlled by French Missionaries and Traders.A number of forts are located in and around Hudson Bay. These would be the forts recently seized from the English Hudson Bay Company in 1686 an which at the time of the publication of the map were the subject of active conflict between the French and English forces in the region.
The four short notes on the map identify four areas of settlement and fur trading activities:
Poste pour couper les Sauvages par le haut de la traite de Tadoussac et les empêcher de descendre à la Baye de Hudson. (Translation: Post to intercept the Indigenous peoples at the upper Tadoussac trade route and prevent them from descending to Hudson Bay.") This section indicates a strategic location near Tadoussac, an important trading post established in 1600 by Pierre de Chauvin de Tonnetuit. Tadoussac was a key site for the fur trade between the French and Indigenous peoples. The notation reveals efforts to control the movement of Indigenous groups, particularly in the context of the fur trade, by preventing them from reaching the lucrative markets of Hudson Bay. The neighboring English settlement is Rupert House (Fort Rupert).
Poste du Sr. de S. Germain pour couper pres que tous les Sauvages du Nort et les empêcher de descendre à la Baye de Hudson. (Translation: "Post of Sr. de S. Germain to intercept nearly all the Indigenous peoples from the North and prevent them from descending to Hudson Bay."). Highlighting another strategic outpost, this section references Daniel Greysolon, Sieur DuLhuta French soldier and explorer who was largely responsible for establishing French control over the country north and west of Lake Superior.. This post aimed to control northern Indigenous trade routes and limit their access to Hudson Bay, thereby securing French trade interests in the region, possibly in coordination with the Compagnie des Cent-Associés (Company of One Hundred Associates), established in 1627 to manage the colony's resources. The neighboring English settlement includes Moose Factor (Fort Saint-Louis).
Poste du Sr. Duluth pour empêcher les Assiniboels et autres Sauvages de descendre à la Baye de Hudson. (Translation: "Post of Sr. Duluth to prevent the Assiniboine and other Indigenous peoples from descending to Hudson Bay."). This notation points to a post established by Daniel Greysolon, Sieur du Lhut (Duluth). His efforts in the 1670s and 1680s to establish posts and alliances with Indigenous groups were crucial in French attempts to dominate the fur trade by controlling access to Hudson Bay.
Poste François decouvert et occupé par la Compagnie qui s'est formée en Canada pour la Baye de Hudson. (Translation: "French post discovered and occupied by the Company formed in Canada for Hudson Bay.").
Hudson Bay Company and French Fur Trading Conflicts in the 17th Century
In the 17th century the French had a de facto monopoly on the Canadian fur trade. Two French traders, Pierre-Esprit Radisson and Médard des Groseilliers (Médard de Chouart, Sieur des Groseilliers), Radisson's brother-in-law, learned from the Cree Indians that the best fur country lay north and west of Lake Superior. They sought French backing for a plan to set up a trading post on Hudson's Bay. Thee French refused. In 1659, without official support, Radisson and Groseilliers set out for the upper Great Lakes basin. A year later they returned with premium furs, evidence of the potential of the Hudson Bay region. Subsequently, they were arrested for trading without a license and fined, and their furs were confiscated.
Radisson and Groseilliers approached a group of English businessmen in Boston, who agreed on the plan's merits but their speculative voyage in 1663 failed when their ship ran into pack ice in Hudson Strait. Colonel George Cartwright learned of the expedition and brought the two to London in 1665, where they gained the sponsorship of Prince Rupert. In 1668 the English expedition acquired two ships, the Nonsuch and the Eaglet, departing on June 5, 1668. Once in James Bay, the expedition established the first fort on Hudson Bay, Charles Fort, at the mouth of the Rupert River. (It was later known as Rupert House, and developed as the community of present-day Waskaganish, Quebec.) After a successful trading expedition over the winter of 1668–69, Nonsuch returned to England with the first cargo of fur, which was sold to Thomas Glover, one of London's most prominent furriers.
The Governor and Company of Adventurers of England Trading into Hudson's Bay was incorporated on May 2,1670, with a royal charter from King Charles II, graining the company a monopoly over the region drained by all rivers and streams flowing into Hudson Bay in northern Canada. The area was named "Rupert's Land".
The HBC established six posts between 1668 and 1717. Rupert House (1668), Moose Factory (1673) and Fort Albany (1679) were erected on James Bay and Fort Severn (1689), York Factory (1684) and Fort Churchill (1717) on Hudson's Bay.
The early coastal factory model of the English contrasted with the system of the French, who established an extensive system of inland posts at native villages, and sent traders to live among the tribes of the region, learning their languages and often forming alliances through marriages with indigenous women. In March 1686, the French sent a raiding party under the Chevalier des Troyes to capture the HBC posts along James Bay. The French appointed Pierre Le Moyne d'Iberville, who had shown great heroism during the raids, as commander of the company's captured posts. In 1687 an English attempt to resettle Fort Albany failed due to strategic deceptions by d'Iberville. After 1688 England and France were officially at war, and the conflict played out in North America as well. D'Iberville raided Fort Severn in 1690 but did not attempt to raid the well-defended local headquarters at York Factory. In 1693 the HBC recovered Fort Albany; d'Iberville captured York Factory in 1694, but the company recovered it the next year.
In 1697, d'Iberville again commanded a French naval raid on York Factory. On the way to the fort, he defeated three ships of the Royal Navy in the Battle of Hudson's Bay (September 1697), the largest naval battle in the history of the North American Arctic. D'Iberville's depleted French force captured York Factory by laying siege to the fort and pretending to be a much larger army. The French retained all of the outposts except Fort Albany until 1713. (A small French and Indian force attacked Fort Albany again in 1709 during Queen Anne's War but was unsuccessful. The economic consequences of the French possession of these posts for the company were significant; HBC did not pay any dividends for more than 20 years. (Ref: Stevenson; Tooley; M&B)
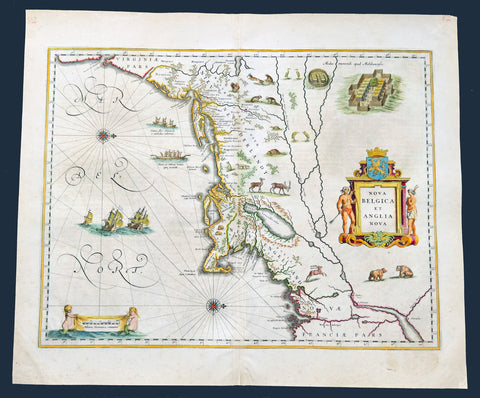
1641 Joan Blaeu Antique Landmark Map New England & New Netherlands
Antique Map
- Title : Nova Belgica Et Anglia Nova
- Size: 22 1/2in x 19in (570mm x 480mm)
- Condition: (A+) Fine Condition
- Date : 1641
- Ref #: 61201
Description:
This beautiful, original hand coloured copper-plate engraved antique landmark map of the Dutch & British colonies of New England & NE America, centering on New York and Manhattan stretching from Virginia to Maine, by Joan Blaeu was published in the 1641 German edition of Atlas Novus.
This important landmark map of the American Northeast, presenting the regions settled by the Dutch (New Netherlands) and the English (New England). Oriented to the west, Blaeu's map covers the American coast from Virginia, past New York and Long Island to Cape Cod, New England, and Quebec. The map is the first of the region to depict the fur-bearing and food animals of the region accurately, and it does so in profusion. Between this imagery and the fleet of trade ships heading towards the coast, the decorative elements vividly emphasize the region's resource wealth.
This map is cartographically derived from data accumulated by Adriaen Block and other Dutch fur traders active in the early 17th century. Burden writes of the Block:
......This important map was one of the most attractive of the Americas at the time...... It is noted for the fact that its primary source is the first manuscript map of Adriaen Block, 1614. Indeed, it is the first full representation of it in print. It is one of the earliest to name Nieu Amsterdam. Block, a Dutch fur trader, explored the area between Cape Cod and Manhattan, examining the bays and rivers along the way. This helped to create an accurate picture of the longitudinal scale of the coastline. His manuscript map was the first document to delineate an insular Manhattan; it also provides the earliest appearance of Manhates and Nieu Nederland.
General Definitions:
Paper thickness and quality: - Heavy and stable
Paper color : - off white
Age of map color: - Original
Colors used: - Yellow, green, blue, pink
General color appearance: - Authentic
Paper size: - 22 1/2in x 19in (570mm x 480mm)
Plate size: - 19 1/2in x 15 1/2in (495mm x 395mm)
Margins: - Min 1in (25mm)
Imperfections:
Margins: - Light age toning in margins
Plate area: - None
Verso: - Old soiling bottom left of verso not affecting the image. Top, bottom of centerfold re-enforced on verso. Top left corner of margin re-enforced
Background:
This important map was one of the most attractive of the Americas published at the time. It is noted for the fact that its primary source is the first manuscript figurative map of Adriaen Block from 1614. Indeed it is the first full representation of it in print. It is one of the earliest to name Nieu Amsterdam. Block, a Dutch fur trader, explored the area between Cape Cod and Manhattan, examining the bays and rivers along the way. This helped to create an accurate picture of the longitudinal scale of the coastline. His manuscript map is the first document to delineate an insular Manhattan; it also provides the earliest appearance of Manhates and Niev Nederland.
It has been noted that the time difference between 1614, the date of the manuscript, and Blaeus map whose first appearance is in 1635, appears long for such an important advance. It would seem highly feasible that Blaeu, who published many separately issued maps, would have wanted to produce one like this sooner. However, evidence points to the fact that it could not have been made before 1630. The Stokes Collection in New York possesses an example of the map on thicker paper without text on the reverse which could well be a proof issue of some kind.
There are features on Blaeus map that differ from the Block chart. Some of these could be accounted for by the fact that the surviving figurative map is not the original, and that the copyist omitted some place names that are referred to in the text of de Laets work. Block drew on Champlains map of 1612 for the depiction of the lake named after him, but it is here called Lacus Irocoisiensis. … The lack of interrelation between the Dutch or English colonies and the French, led for some time to the eastward displacement of this lake when its true position would be north of the Hudson River.
Some nomenclature has its origins in Blaeus second Paskaert of c.1630, and others, such as Manatthans, in de Laet. The colony of Nieu Pleimonth is identified. This and other English names along that part of the coast are largely derived from Smiths New England, 1616. Cape Cod is here improved over the Block manuscript by being reconnected to the mainland, the narrow strait having been removed. The coastline between here and Narragansett Bay, which can be clearly recognized, is not so accurate. Adriaen Blocx Eylandt leads us to the Versche Rivier, or Connecticut River, which Block ascended as far as was possible. t Lange Eyland is named; however, it is incorrectly too far east, being applied to what is possibly Fishers Island. De Groote bay marks Long Island Sound. The Hudson River is still not named as such, but is littered with Dutch settlements, and the failed Fort Nassau is here depicted renamed as Fort Orange. He does, however, improve on the direction of its flow. Blaeu separates the sources of the Hudson and Delaware Rivers which had been causing some confusion. Nieu Amsterdam is correctly marked as a fort at the tip of an island separated on the east side by Hellegat, or the East River. The coastline south of Sandy Hook also shows signs of improvement.
The whole map is adorned by deer, foxes, bears, egrets, rabbits, cranes and turkeys. Beavers, polecats and otters appear on a printed map for the first time. The Mohawk Indian village top right is derived from the de Bry-White engravings.
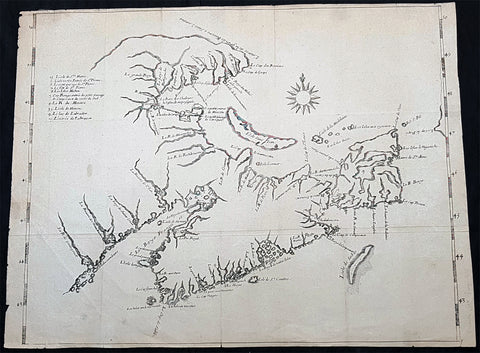
1672 Nicolas Denys Extremely Rare Map of Acadia, Quebec, Nova Scotia Canada
Antique Map
- Title : (Acadia; Quebec)
- Size: 20 3/4in x 16in (680mm x 520mm)
- Condition: (A) Very Good Condition
- Date : 1672
- Ref #: 31916
Description:
This original copper plate engraved, antique very rare map of Acadia, Nova Scotia in eastern Canada by the founding father of Acadia Nicolas Denys, was published in his 1672 edition of Description Géographique et Historique des Costes de l'Amérique Septentrionale....
The map is very rare, since a number of the copies of the book do not appear to have had the map included. From our research we have realised two versions of this map, with an obvious difference. One map that shows latitude 42 numeric at the bottom left and another edition without.
The map without the numeric 42 can be seen online, from the McGill university, digitised by the Haiti Trust online library, P #38.
The map with the numeric can be found on the Gallica open-access digital library of the Bibliothèque nationale de France (BnF)
Both are easily searchable on each site using Denys name.
There are also other copies to be found online.
The map carries 92 place names. On it Denys delineates the coasts he explored and traded on, from Penobscot Bay to Cap Gaspe, including all of Nova Scotia.
Nicolas Denys was a founding father of Acadia and one of its leading figures for over half of the 17th century. Denys was given Cape Breton Island by Louis XIV, in 1670, as a reward for services rendered. He wrote his account of the region at Nipisiguit on Chaleur Bay.
The map contains a number of place names, which are still in use today, that did not appear on earlier printed maps : Le Fort de St. Pierre, La R. de Cocanne, Le Cap de Tourmentin, Chedabouctou… Denys used the basic cartography of Sanson for mainland Nova Scotia, Quebec and New Brunswick, but with an entirely new, although distorted outline for Cape Breton.
He shows a large inlet, Le Lac de Labrador, which was sometimes retained by later cartographers, with its southwest corner separated by a wide isthmus from sea at Le fort de St. Pierre, present-day St. Peters Bay.
General Definitions:
Paper thickness and quality: - Heavy and stable
Paper color : - off white
Age of map color: -
Colors used: -
General color appearance: -
Paper size: - 20 3/4in x 16in (680mm x 520mm)
Plate size: - 20 3/4in x 16in (680mm x 520mm)
Margins: - Min 1/2in (15mm)
Imperfections:
Margins: - Light chipping to left edge
Plate area: - Folds as issued, light creasing along folds
Verso: - Folds as issued, light creasing along folds, several small re-joins of folds to edges
Background: A century and a half after the first voyage of Columbus in 1492, northern North America beyond the Atlantic coastline was still barely known.
Before 1656 three entryways had been established: Davis Strait, Hudson Bay, and the St Lawrence valley It took another century and a half of laborious probing across the great plains and through the western mountains to reach the Pacific coast, where explorers met other Europeans who were arriving there too, overseas from the west.
Portuguese, Spanish, and Russians dominated the earliest coastal reconnaissance activity but then retreated. Inland the French uncovered what became Canada’s ecumene in the 20th century, while the British uncovered the rest of the landmass, all the way to the Arctic Ocean. The Canadian landmass was however revealed largely because it fed a craze for fur-based consumer products in Europe.
In the last years before 1632, inland explorers for the first time bridged gaps between places already known: between modern Quebec City and the coast of Maine, and between the Delaware River and Lake Ontario.
Throughout this period of 135 years, the coast of Labrador and northeastern Newfoundland were the most heavily traveled parts of the future Canadian territory.
Exploration of the fiords of today’s British Columbia coast and Alaska panhandle intensified in the last quarter of the eighteenth century, and in 1793 Alexander Mackenzie, a Montrealer, reached the head of one of those fiords at Bella Coola. He thus completed the land crossing of America begun some two centuries earlier.
After nearly two centuries, Great Britain was actively seeking the Northwest Passage and in 1818 a newly established border with the United States created another need for new and more accurate maps.
Nicolas Denys (1598? – 1688) was a French-born merchant, governor, writer, and settler in New France. He founded settlements at St. Pierre (now St. Peter's, Nova Scotia), Ste. Anne (Englishtown, Nova Scotia) and Nepisiquit (Bathurst, New Brunswick).
Denys' writings about the lands and peoples of Acadia were published in two volumes in 1672. The work, entitled The Description and Natural History of the Coasts of North America, remains the leading authority regarding the conditions of Acadia for the years 1632 through 1670.
When Cardinal Richelieu authorized a stronger French presence in the New World, he commissioned Isaac de Razilly to be lieutenant-general of Acadia and Nicolas Denys accompanied the expedition as one of de Razilly's lieutenants. The expedition set sail in 1632 with 300 hand-picked men, supplies, six Franciscan missionaries, and Simon Denys (Denis) de La Trinité (1599-1678), brother of Nicolas Denys. Simon Denys was a future seigneurial attorney and receiver general for the Compagnie des Cent-Associés, who was appointed to the ruling Sovereign Council of New France in 1664, then ennobled by Louis XIV, in 1668.
They founded a colony at the LaHave River where Denys engaged in inshore fishing, lumbering and fur trading. French administrators, including nearby Port Royal's lord, the Sieur Charles de Menou d'Aulnay, thought little of the colonists’ reclaiming tidal marshlands. Denys was very impressed with the “great extent of meadows which the sea used to cover and which the Sieur d'Aulnay has drained” It was this extensive system of dikes and drainage sluices (called aboiteaux) that set his colony apart from any others. It allowed the colonists to reclaim land that the Mi'kmaq nation had no use for. This greatly aided peaceful co-existence with their neighbors, and Mi’kmaq trade, friendship and intermarriage was and is an immensely important part of the Acadian identity and heritage.
When Denys arrived in 1632 the aboriginal community was already using iron kettles, axes, knives, and arrowheads, but few had firearms. Before the use of kettles the Mi’kmaq used hollowed out tree trunks in which to boil their unsalted food, dropping in hot stones to heat the water. Possessing kettles, they were free to move anywhere and became more mobile, changing their habitations often. Denys remarked on excessive hunting in his diaries. Moose, formerly in great numbers on Cape Breton Island, had been exterminated by hunting with muskets. There were no longer any moose on Prince Edward Island and the caribou were in reduced number. Alcohol, however, not over-hunting, was a major cause of Mi’kmaq decline.
When de Razilly died in December 1635 the colony broke up and Nicolas Denys returned temporarily to France. In 1636, Denys was granted a seignory by the French crown, apparently the third grant in the colony of Acadie and in 1642 he married Marguerite de Lafitte in France, but soon took his new family across to his adopted lands of Acadia.
Denys was a witness to one of the most unfortunate chapters of early Acadia's history: the rivalry between the Lords d’Aulnay and Charles de Saint-Étienne de la Tour, as it dissipated efforts to grow the colony. La Tour had claimed royal permission to ply the fur trade in the American Northeast. His rival outposts were in often-open hostility with the budding d’Aulnay colony, competing for resources and markets. Decades of sparring led to bloodshed. In the Spring of 1643 La Tour led a party of English mercenaries against the Acadian colony at Port Royal. His 270 Puritan and Huguenot troops killed three Acadians, burned a mill, slaughtered cattle and seized 18,000 livres' worth of furs. D'Aulnay retaliated in 1645 by seizing all of La Tour's possessions and outposts while La Tour was drumming up more support for his cause in the English colonial port of Boston. Denys’ letters and journals give vivid descriptions of the drama.
Once he secured rights to his own lands in Acadia through the Company of New France, Denys continued to seek his fortunes now as the Governor of Canso and Isle Royale (present-day Cape Breton Island). Denys founded settlements at St. Pierre (now St. Peter's, Nova Scotia, site of the Nicholas Denys Museum), Ste. Anne (Englishtown, Nova Scotia) and Nepisiquit (Bathurst, New Brunswick).
His 'fortunes' had some reversals, however. Sieur Emmanuel le Borgne, a rival with holdings at Port Royal, seized his properties by armed force in 1654 while Denys was at Ste. Anne. Later that year, King Louis XIV recognized Denys’ claims to the property lost to le Borgne and Le Borgne was commanded to restore them to Denys.
The Denys family, including his wife and son Richard Denys, made their home in St. Pierre, and dwelt there in relative calm until the Winter of 1669, when Nicolas’ home and business were consumed in a fire. Denys relocated his family to Nepisiquit, on Baie Chaleur, just south of the Gaspé Peninsula, and there he turned his efforts to writing. Leaving his son Richard in charge of his holdings, he travelled to Paris to publish his Description Géographique et Historique des Costes de l’Amérique Septentrionale: avec l’Histoire Naturelle du Païs. Released in 1672, it was not a success. He remained in Paris for several years, returning impoverished to Nepisiguit a few years before his death.
Denys died in 1688 at Nepisiquit, a town of his own creation. During his tenure in the New World, he appears to have offered more stability of governance than those other royal appointees around him. Denys is well known through his writings about the lands and peoples of Acadia, especially his Description, published in two volumes in 1672. This work was edited and translated into English by Professor William Francis Ganong and published in 1908 as part of the Champlain Society's General Series. Ganong was a distant cousin of Denys.
Nicolas Denys and his work, translated as Description and Natural History of the Coasts of North America, remains the leading authority regarding the conditions of Acadia for the years 1632 through 1670.
Please note all items auctioned are genuine, we do not sell reproductions. A Certificate of Authenticity (COA) can be issued on request.
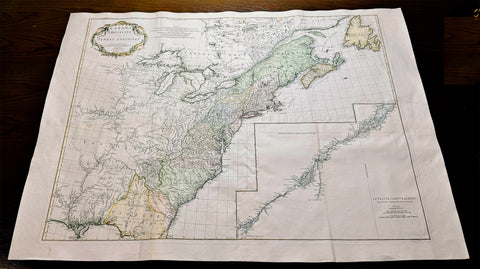
1755 D 'Anville Large Antique Map of North America, Great Lakes, 13 Colonies
Antique Map
- Title : Canada Louisiane et Terres Anglois Par Le Sr. D Anville...MDCCLV
- Ref #: 61140
- Size: 52in x 38in (1.32m x 960mm)
- Date : 1755
- Condition: (A+) Fine Condition
Description:
This magnificent, scarce, very large (52in x 38in) hand coloured & highly detail map of North America was engraved in 1755 - dated in the title cartouche - by George De La Haye and was published by Jean Baptiste Bourguignon D Anville in his large elephant folio atlas Atlas Generale.
Geopolitically this map is extremely significant drawn as war between the Global Powers of the day, France, England & Spain, was breaking, known in Europe as the Seven Year War known in North America as the French & Indian war. (Please see below for more detail)
This map rivals John Mitchells "A Map of the British and French Dominions in North America published in 1755" - considered to be one of the most significant maps of North America published in the 18th & 19th centuries (a 1st edition of Mitchells map is currently for sale for $165,000).
I have included an image of the Mitchell map for comparison. The D Anville map is considered by many to be cartographically superior to the Mitchell map, at a fraction of the price.
General Description:
Paper thickness and quality: - Heavy and stable
Paper color: - White
Age of map color: - Early & later
Colors used: - Pink, yellow, green
General color appearance: - Authentic
Paper size: - 52in x 38in (1.32m x 960mm)
Plate size: - 45in x 35in (1.12m x 890mm)
Margins: - Min 1in (25mm)
Imperfections:
Margins: - None
Plate area: - Light ceasing along folds
Verso: - Very small worm holes
Background: This extraordinary map of the eastern half of North America extends from Newfoundland, Canada to St. Augustine, Florida, stretching westward beyond the Mississippi as far as modern day Texas. The map includes both the original colonial colonies along the Atlantic seaboard from Maine to Georgia and the French claims in Louisiana (the Mississippi Valley) and modern day Canada. Florida is acknowledged as a Spanish enclave. Elevation is rendered in profile with fortifications, towns, and American Indian villages identified. A large inset map centres on the course of the St. Lawrence River from the Isle Aux Coudres to Lake Ontario.
The is a very significant map, drawn from a definitive French perspective, defining the territorial alignments and claims within North America shortly following the outbreak of the French and Indian War, considered to be a New World reflection of the European Seven Years War. It is however notable that it began before the larger hostilities in Europe and most of the major battles involved primarily parties only loosely aligned with the French or English - most specifically American Indians and lawless frontiersman, who had their own political agenda.
The war began with French incursions into western Pennsylvania and other territories claimed simultaneously by the French, English and American Indian forces. Just prior to the war, the French, in the interest of broadening their hold on the lucrative fur trade, established a series of forts, all of which are here noted, along the length of the Mississippi and further east, including Fort Duquesne (here Fort de Quene, Pittsburgh), Fort de la Presquisle, and for Le Beouf (here, Fort de la Riv Jaus Beufs).
The map also recognizes British claims, only inland as far as the Appalachian Mountains, beyond which place names take on a noticeably French character. These last three forts occupied particularly contested territory under the control of the powerful British allied Iroquois League. The most contested of these was Fort Duquesne (modern day Pittsburgh) in direct opposition to another fort then being constructed by the Ohio Company, a trading and land speculation firm established by prominent Virginia colonials, including George Washington. The Virginian colonial governor responded to Duquesne by sending then Lieutenant George Washington and a band of Virginia militiamen to harass the French. The resulting Jumonville Affair, in which Washington oversaw an attack on a French Canadian diplomatic forces led by Joseph Coulon de Villiers de Jumonville, to warn the Ohio Company fort builders away from French claimed territory. The slaying of Jumonville and several other French diplomats prompted a response from French forces at Fort Duquesne, leading to Washingtons retreat and construction of Fort Necessity, really little more than a palisaded shack, marked here just south of Fort Duquesne. These events, all of which occurred in May of 1754, were said to have increased hostilities in Europe and led to the start of the Seven Year War in 1755.
Beyond the political agenda of this map, is the map itself, being one of the finest and most heavily detailed maps of North America published in the mid 18th century. Ranking alongside the large 1755 Mitchell map in detail but judged by many as cartographically superior. Drawing on both French and British cartographical detail, D Anville identifies countless American Indian tribes, many of which, like the Sioux and Missouri, the British had only vague knowledge. Moreover, he also includes detail such as swamps, rapids, fords, abandoned villages, and even the ancient remnants of mound builder culture in the Ohio Valley. D Anville notably does not include Mitchells fictional Lake Superior islands.
This map was originally published to accompany the pamphlet entitledMemoire sur la carte intitulee: Canada, Louisiane, & Terres angloises and was also published in four parts for D Anvilles Atlas General.
These large maps are hard to find in such good condition and make fantastic historical reference tools due to the size and high level of detail as with all D Anvilles work. (Ref: Tooley, M&B)
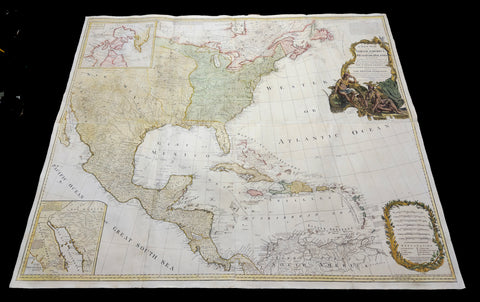
1786 (1794) Thomas Pownall & Sayer Large Revolutionary War Map North America
Antique Map
- Title : A New Map of North America with the West India Islands, divided according to the Preliminary Articles of Peace, Singed at Versailles, 20, jan 1783, wherein are particularly Distinguished The United States, and the Several Provinces, Governments & ca which Compose the British Dominions, Laid down according to the Latest Surveys, and Corrected from the Original Materials of Goverr. Pownall, Membr. of Parlimt....1794
- Size: 47in x 41in (1.20m x 1.050m)
- Condition: (A+) Fine Condition
- Date : 1794
- Ref #: 35672
Description:
A large, extraordinary important, original rare copper-plate engraved and hand coloured map of North America by Governor Thomas Pownell, was engraved and updated in 1786 and updated by Thomas Kitchin in 1794 - dated in cartouche - and published in "A general atlas, describing the whole universe: being a complete collection of the most approved maps extant; corrected with the greatest care, and augmented from the latest discoveries" by Robert Sayer, Laurie and Whittle.London.
This map was first issued by Emmanuel Bowen and John Gibson in 1755 and went through numerous iterations over the next 40 years. This edition was issued shortly after the end of the American Revolutionary War and the Treaty of Paris in 1783. The map details the newly formed United States of America in Green, the British & French dominions in Canada in Red, plus the extensive Spanish territories of from Florida, Louisiana Mexico and Central America. As one might expect from a map of this size, the detail throughout is extraordinary.
General Definitions:
Paper thickness and quality: - Heavy and stable
Paper color : - off white
Age of map color: - Original
Colors used: - Yellow, green, blue, pink
General color appearance: - Authentic
Paper size: - 47in x 41in (1.20m x 1.050m)
Plate size: - 46in x 40in (1.10m x 990mm)
Margins: - Min 1in (20mm)
Imperfections:
Margins: - None
Plate area: - Light toning & offsetting
Verso: - Light age toning.
Background:
This monumental 1794 map of North America by Governor Thomas Pownell was issued shortly after the end of the American Revolutionary War. The United States at this time extended from the Pacific to the Mississippi River and from Georgia to the Great Lakes and Maine. The early state boundaries roughly conform to their original colonial charters. Virginia, North Carolina, and South Carolina are drawn with indefinite western borders, suggesting claims to further unexplored land beyond the Appellation Mountains. By this time most of the boundary issues in the New England states had been resolved, though there remained some vagaries regarding the Massachusetts Connecticut border and, though Vermont is noted textually, its boundaries are not drawn in. At this time there were also some unresolved issues regarding the national borders between Maine and Nova Scotia. In Pennsylvania, the western border displays some surveying confusions that would not be resolved until the early 1800s and the creation of Ohio.
It is beyond the old colonial centers where this map really gets interesting. Pownall offers copious notations on the lands and territories between the Appellation range and this Mississippi River. In some cases he offers commentary on the various indigenous tribes including the Creeks, Chickasaws, Chocktaws, Senekas, Eriez, Delawares, Shawnee, Iroquois, Algonquians, Ottawas and others. The cartographer was clearly concerned with the development of these western regions and offers copious commentary on fit sites for factories, the alliances and temperaments of tribes, and the navigability of various river systems, particularly the Mississippi and Ohio.
The Great Lakes are mapped with considerable accuracy though several apocryphal islands do appear in Lake Superior. The most notable of these are Phelipeaux and Pontchartrain. Phelipeaux Island first appeared in French maps of this region in the 1740s. Later it was mentioned as a boundary marker in the 1783 Treaty of Paris which ended the American Revolutionary War. The nonexistence of these islands was not conclusively proven until about 1820.
To the west of the Mississippi we pass into the largely unknown lands of the Great Plains. In what is roughly modern day Missouri, between Memphis and St. Louis, there is an interesting note suggesting that this region is Full of Mines, with a secondary note suggesting that these mines gave rise to the Mississippi Scheme of 1719. This refers to the Mississippi Company (Compagnie du Mississippi) or, as it was more commonly known the Indies Company (Compagnie d Occident). This organization was part of a French investment plan comparable to the South Seas Company which was developing contemporaneously in England. The Mississippi Companys charter was to trade the riches of the Louisiana Territory. The main proponent of the Mississippi Company, John Law, greatly exaggerated the wealth of Louisiana by describing a rich mining region easily accessible along the Mississippi from New Orleans. This resulted in a stock buying rush which disproportionately overvalued Mississippi Company stock, resulting in one of the world's first Bubble Economies.
Further North, along the northern border between the United States and British America (Canada), Rain Lake, the Lake of the Woods, and Lake Winnepeg are noted. This region was a hotbed of exploration throughout the 18th century. French and English concerns in the New World were desperate for access to the Pacific and the rich Asian markets. These markets had long been dominated by the Spanish who had easy access to the Pacific via Mexico and South America. The French and English set their hopes on a Northwest Passage. By the late 18th century the search for a route through the high Arctic had long been abandoned. Instead, explorers and theoretical cartographers believed that a water route might be found among the elaborate network of lakes and rivers that meandered through central Canada. Our map shows evidence of some of this exploration, particularly the travels of the Quebec born Pierre de La Verendrye and his sons around Lake Alimipigon, the Lake of the Woods (Lake Minitti) and Lake Winnipeg (Lake Ouinipigon).
As we progress even further west, passing out of Louisiana into the Spanish holdings we begin to see significant mapping - both conjectural and factual. The Spanish had long been passively active in the exploration of New Mexico. Though no concerted effort had been put forth to map the region, various missionaries and territorial governors had, over roughly 200 years of occupation added considerable data, both fact and fiction to the cartographic picture. Numerous American Indian groups are noted including the Pimas, the Apaches ,the Navajo and others. Along the Rio del Norte or upper Rio Grande there are a quantity mission stations including the regional capital of Santa Fe.
Just to the west of these missions we begin to enter more mythical territory and both Cibola and Teguayo are noted. Cibola and Teguayo are both associated with the legendary Seven Cities of Gold. It was believed that in 1150 when Merida, Spain, was conquered by Moors ,the city's seven bishops fled to unknown lands taking with them much of the citys riches. Each Bishop supposedly founded a great city in a far away place. With the discovery of the New World and the fabulous riches plundered by Cortez and Pizarro, the Seven Cities became associated with New World legends. Coronado, hearing tales of the paradise-like mythical Aztec homeland of Azatlan somewhere to the north of Mexico , determined to hunt for these cities in what is today the American southwest. In time indigenous legends of rich and prosperous lands became attached to the seven cities. Two of these appear on our map - Cibola and Teguayo.
The gulf of Mexico, the West Indies, and the Caribbean are charted with considerable and typical accuracy. Notes numerous offshore shoals, reefs, and other dangers - especially around the Bahamas. Also describes several important shipping routes, particularly the former routes of Spanish galleons from Veracruz to Havana, the route from Cartagena to Havana, and the route from Cartagena to Europe.
There are also two particularly interesting insets. The first, in the upper left quadrant, depicts the Canadian arctic, particularly the Hudson and Baffin Bays. Notes all of the most recent discoveries in this region and offers interesting notes such as If there is Northwest Passage it appears to be through one of these inlets. In the northwestern quadrant of this inset, the supposed discoveries of Admiral de Fonte are included, despite a notation that they are Imaginary.
The second inset of interest in located in the lower left quadrant. This smaller maps depicts the northern parts of the Gulf of California and the Colorado River Delta based upon the explorations of the Jesuit Father Eusebius Francis Kino. The actual cartography of this region has been vague since the mid 17th century when it was postulated that California must be an Island. It was not until Kinos historic expedition, recorded here, that Baja California was conclusively proven to be a peninsula.
A magnificent title cartouche appears in the upper right quadrant. The cartouche, which angles around Bermuda, depicts two stylized American Indians surrounded by the presumed flora and fauna of the new world. These include a small monkey, a parrot, and a jaguar. Above the cartouche is a textual quotation from Article III of the Treaty of Paris, affirming the rights of the United States to access the rich cod fields of Newfoundlands Grand Banks.
The Treaty of Paris, signed in Paris by representatives of King George III of Great Britain and representatives of the United States of America on September 3, 1783, ended the American Revolutionary War. The treaty set the boundaries between the British Empire in North America and the United States, on lines exceedingly generous to the latter. Details included fishing rights and restoration of property and prisoners of war.
This treaty and the separate peace treaties between Great Britain and the nations that supported the American cause—France, Spain, and the Dutch Republic—are known collectively as the Peace of Paris. Only Article 1 of the treaty, which acknowledges the United States existence as free, sovereign, and independent states, remains in force.
Thomas Pownall 1722 - 1805 was a British scholar, statesman and soldier active in the colonial administration of North America just prior to the American Revolutionary War. Pownell was born in England and educated at Trinity College, Cambridge. After graduation he was employed by his brother, John Pownall, at the office of the Lords Commissioners of Trade and Plantations, which oversaw British economic interests in its North American colonies. In 1753, Pownall was appointed secretary to the governor of New York, Sir Danvers Osborne. Osborne, himself having be only recently appointed to the position, committed suicide shortly after taking office. Despite this setback, Pownall remained in America and devoted himself to studying and researching the colonies. In the process Pownall became close lifelong friends with Benjamin Franklin and other New World luminaries. He also published several notable works on the colonial administration of North America. In 1757 Pownall was appointed Governor of the Massachusetts Bay colony. In this position he frequently found himself at odds with the restrictive policies of the Board of Trade. It was not long before he was pushed out of office and, declining the governorship of Jamaica, reassigned to South Carolina. Despite nominally holding the governorship of South Carolina, Pownall never visited the colony. Instead he returned to England where he eventually became a member of Parliament. In Parliament, he advocated for reduced taxes towards the colonies - had he been heeded, the American Revolution may have never happened. Pownall retired from public life around 1780, but continued to pursue his scholarly interests. Pownalls research contributed significantly to several important maps and scholarly work on North America.
Laurie and Whittle 1794 - 1858 based in London, were map and atlas publishers active in the late 18th and early 19th century. Generally considered to be the successors to the Robert Sayer firm, Laurie and Whittle was founded by Robert Laurie (c. 1755 - 1836) and James Whittle (1757-1818). Robert Laurie was a skilled mezzotint engraver and is known to have worked with Robert Sayer on numerous projects. James Whittle was a well-known London socialite and print seller whose Fleet Street shop was a popular haunt for intellectual luminaries. The partnership began taking over the general management of Sayers firm around 1787; however, they did not alter the Sayer imprint until after Sayers death in 1794. Apparently Laurie did most of the work in managing the firm and hence his name appeared first in the Laurie and Whittle imprint. Together Laurie and Whittle published numerous maps and atlases, often bringing in other important cartographers of the day, including Kitchin, Faden, Jefferys and others to update and modify their existing Sayer plates. Robert Laurie retired in 1812, leaving the day to day management of the firm to his son, Richard Holmes Laurie (1777 - 1858). Under R. H. Laurie and James Whittle, the firm renamed itself Whittle and Laurie. Whittle diedin 1818, and thereafter the firm continued under the imprint of R. H. Laurie. After Lauries death the publishing house and its printing stock came under control of Alexander George Findlay, who had long been associated with Laurie and Whittle. Since, Laurie and Whittle has passed through numerous permeations, with part of the firm still extant as an English publisher of maritime or nautical charts, Imray, Laurie, Norie and Wilson Ltd. The firm remains the oldest surviving chart publisher in Europe.
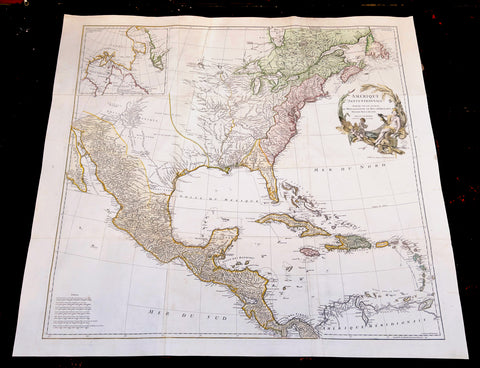
1746 D Anville Large Antique Map of North America - Pre French Indian & Rev. War
Antique Map
-
Title : Amerique Septentrionale Publiee sous les Auspices de Monseigneur le Duc d Orleans.. Par Le Snr. D Anville MDCCXLVI
- Ref #: 17010
-
Condition: (A+) Fine Condition
- Size: 42 1/2in x 37in (1.08m x 940mm)
- Date : 1746
Description:
This large important original copper plate engraved hand coloured antique map of North America, in 12 sheets joined, was engraved in 1746 - dated in the cartouche - and was published by Jean-Baptiste Bourguinon D Anville in his Elephant Folio Atlas Generale.
This map was instrumental in instructing the European Colonial powers of the time, England France & Spain the importance of dominating the New World, that ultimately led to the French and Indian War of 1754–63. This conflict determined the political direction of North America leading to the American War of Independence in 1775 and ultimately the formation of The United States of America.
To illustrate the importance of cartography in the mid eighteenth century, especially that of North America, a J B D Anville map is essential. D Anville dominated 18th century European cartography with many of his cartographical achievements, especially in North America, copied by many of his contemporaries such as Kitchen, Sayer, Homann, Seutter, Mitchell and others .
He was one of the first to leave blank spaces in his maps, where knowledge was scant or insufficient. His representation of the great lakes is superior to that of his contemporary John Mitchell, responsible for publishing one of the most famous mid 18th century maps of North America, A Map of the British and French Dominions in North America on 8 sheets in 1755 and remained the standard map of North America up until the end of the 18th century. (Ref: Tooley, Printed maps of America, 104; The Mapping of America 316)
General Definitions:
Paper thickness and quality: - Heavy and stable
Paper color : - off white
Age of map color: - Original & later
Colors used: - Red, yellow, green, blue
General color appearance: - Authentic
Paper size: - 42 1/2in x 37in (1.08m x 940mm)
Plate size: - 34 1/2in x 33 1/2in (875m x 850mm)
Margins: - Min 1in (25mm)
Imperfections:
Margins: - Small restoration to left margin, not affecting the image
Plate area: - None
Verso: - Age toning
Background:
The French and Indian War (1754–63) comprised the North American theatre of the worldwide Seven Years War of 1756–63. It pitted the colonies of British America against those of New France. Both sides were supported by military units from their parent countries, as well as by American Indian allies. At the start of the war, the French North American colonies had a population of roughly 60,000 settlers, compared with 2 million in the British North American colonies. The outnumbered French particularly depended on the Indians. The European nations declared war on one another in 1756 following months of localized conflict, escalating the war from a regional affair into an intercontinental conflict.
The name French and Indian War is used mainly in the United States. It refers to the two enemies of the British colonists, the royal French forces and their various American Indian allies. The British colonists were supported at various times by the Iroquois, Catawba, and Cherokee, and the French colonists were supported by Wabanaki Confederacy members Abenaki and Mikmaq, and Algonquin, Lenape, Ojibwa, Ottawa, Shawnee, and Wyandot.
British and other European historians use the term the Seven Years War, as do English-speaking Canadians. French Canadians call it La guerre de la Conquête (the War of the Conquest) or (rarely) the Fourth Intercolonial War.
Fighting took place primarily along the frontiers between New France and the British colonies, from Virginia in the south to Newfoundland in the north. It began with a dispute over control of the confluence of the Allegheny River and Monongahela River called the Forks of the Ohio, and the site of the French Fort Duquesne in Pittsburgh, Pennsylvania. The dispute erupted into violence in the Battle of Jumonville Glen in May 1754, during which Virginia militiamen under the command of 22-year-old George Washington ambushed a French patrol.
In 1755, six colonial governors in North America met with General Edward Braddock, the newly arrived British Army commander, and planned a four-way attack on the French. None succeeded, and the main effort by Braddock proved a disaster; he lost the Battle of the Monongahela on July 9, 1755 and died a few days later. British operations failed in the frontier areas of Pennsylvania and New York during 1755–57 due to a combination of poor management, internal divisions, effective Canadian scouts, French regular forces, and Indian warrior allies. In 1755, the British captured Fort Beauséjour on the border separating Nova Scotia from Acadia, and they ordered the expulsion of the Acadians (1755–64) soon afterwards. Orders for the deportation were given by William Shirley, Commander-in-Chief, North America, without direction from Great Britain. The Acadians were expelled, both those captured in arms and those who had sworn the loyalty oath to His Britannic Majesty. Indians likewise were driven off the land to make way for settlers from New England.
The British colonial government fell in the region of modern Nova Scotia after several disastrous campaigns in 1757, including a failed expedition against Louisbourg and the Siege of Fort William Henry; this last was followed by Indians torturing and massacring their British victims. William Pitt came to power and significantly increased British military resources in the colonies at a time when France was unwilling to risk large convoys to aid the limited forces that they had in New France, preferring to concentrate their forces against Prussia and its allies in the European theater of the war. Between 1758 and 1760, the British military launched a campaign to capture the Colony of Canada (part of New France). They succeeded in capturing territory in surrounding colonies and ultimately the city of Quebec (1759). The British later lost the Battle of Sainte-Foy west of Quebec (1760), but the French ceded Canada in accordance with the Treaty of Paris (1763).
The outcome was one of the most significant developments in a century of Anglo-French conflict. France ceded to Great Britain its territory east of the Mississippi. It ceded French Louisiana west of the Mississippi River (including New Orleans) to its ally Spain in compensation for Spains loss to Britain of Florida. (Spain had ceded Florida to Britain in exchange for the return of Havana, Cuba.) Frances colonial presence north of the Caribbean was reduced to the islands of Saint Pierre and Miquelon, confirming Great Britains position as the dominant colonial power in eastern North America.
Please note all items auctioned are genuine, we do not sell reproductions. A Certificate of Authenticity (COA) can be issued on request.